Lecture 19
Comparing means of more than two groups
Comparing means of more than two groups
ABD 3e Chapter 15
Many biological questions involve more than two groups
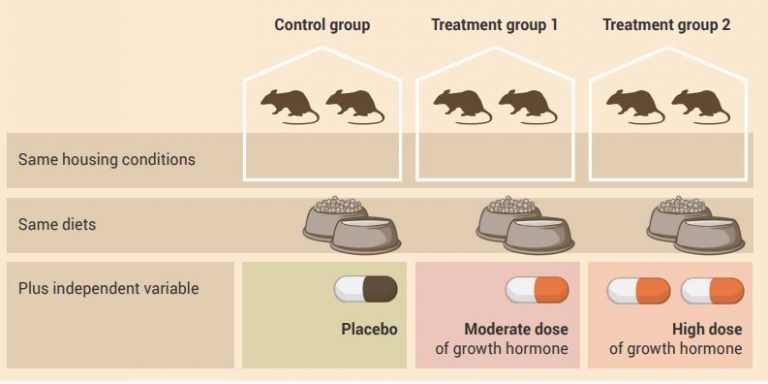
- Experiments often include multiple treatments, not just two
- Example: two medications and a placebo control
- This allows us to ask richer questions:
- Are both treatments better than the control?
- Is one treatment better than the other?
- How large are these differences?
Comparing groups two at a time inflates false positives
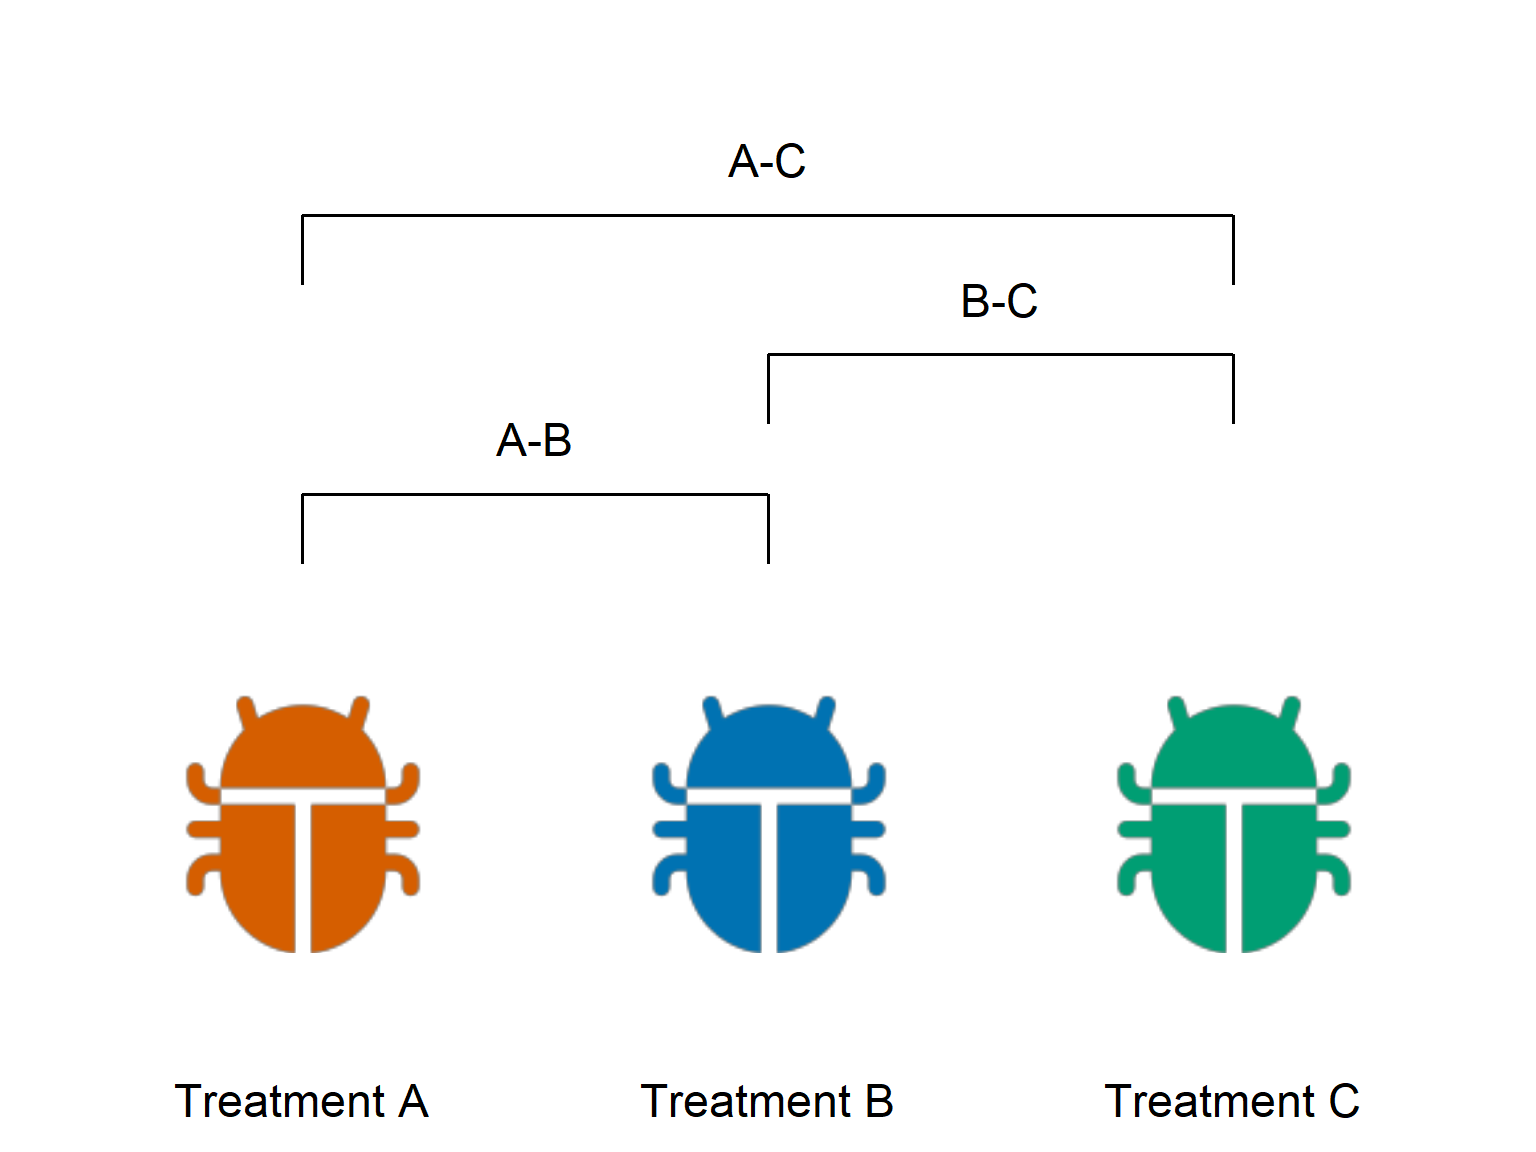
- One approach is to run multiple two-sample tests:
- Group 1 vs 2
- Group 2 vs 3
- Group 1 vs 3
- This seems reasonable, but it does not scale with more groups
Multiple tests inflate Type I error
- Problem:
- Each test has a chance of a Type I error (false positive)
- Multiple tests increase the chance of at least one false positive
- Example:
- 5 groups → 10 pairwise tests
- Up to ~40% chance of at least one false positive if all nulls are true

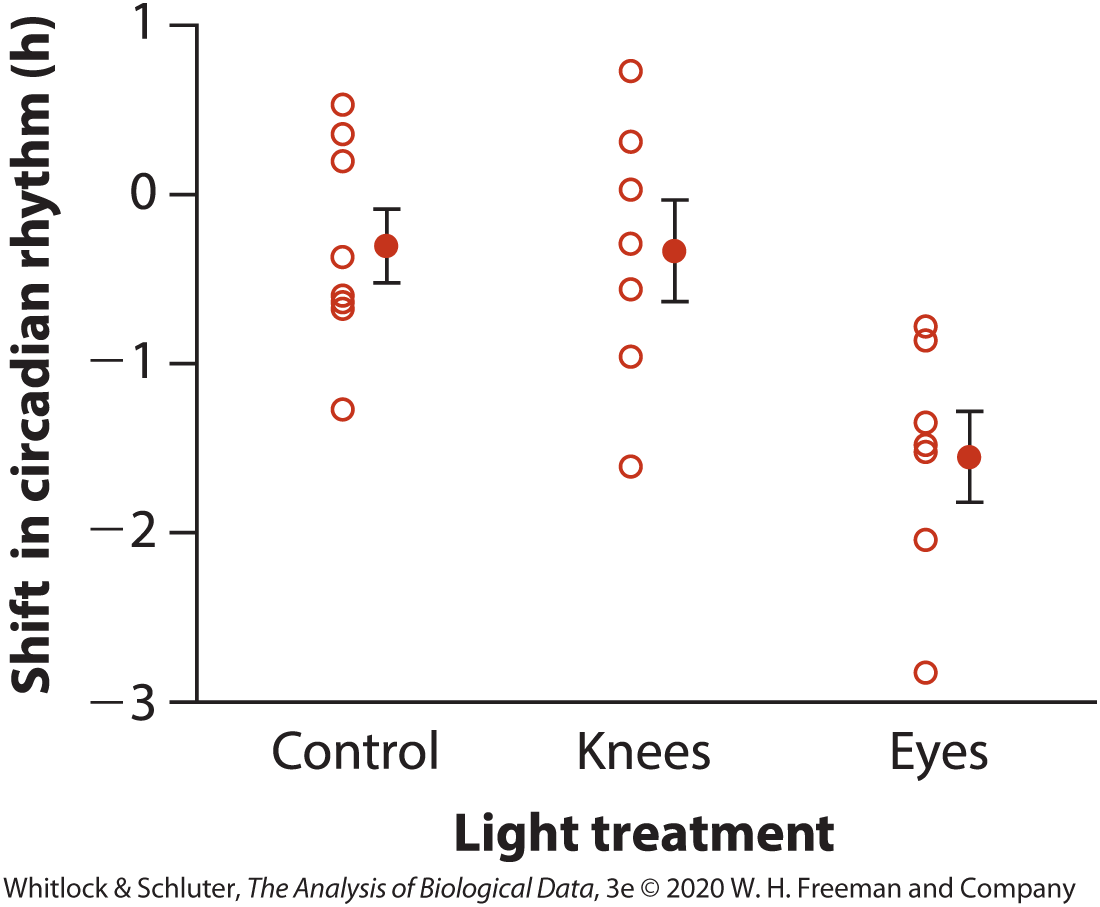
Case Study: Does light exposure affect circadian phase shift?
Study of how light exposure shifts the body’s internal clock (circadian rhythm)
22 participants randomly assigned to one of three treatments:
- No light (control)
- Light to knees
- Light to eyes
Each person received a single 3-hour light exposure
Researchers measured how much each person’s internal clock shifted
Partitioning variation in a real dataset
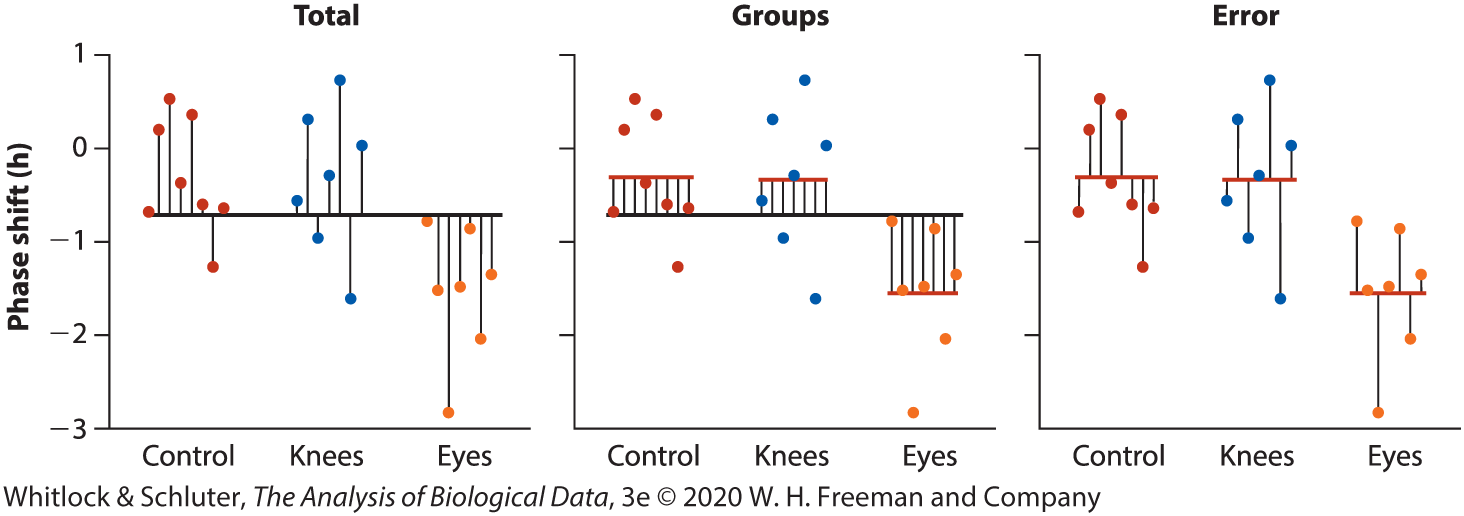
- Same data shown three ways
- Total: differences between each observation and the overall mean
- Groups: differences between each group mean and the overall mean
- Error: differences between observations and their group mean
- Total variation = Groups + Error
- ANOVA asks whether:
- variation among group means is large relative to variation within groups
A significant ANOVA does not tell you which groups differ
- ANOVA tests
- whether any group means differ
- It does not identify:
- which groups are different
- After a significant result:
- we compare specific pairs or sets of groups
- But:
- multiple comparisons increase Type I error
- This requires methods that control the overall error rate