Module 4: Human Population Dynamics and Urban Futures

Chris Merkord

Learning Objectives

By the end of this module, you should be able to:

  • Describe historical and current global population trends
  • Distinguish between growth rate and total population size
  • Explain how fertility, mortality, and migration shape population change
  • Define replacement-level fertility and demographic momentum
  • Compare regional and country-level demographic trajectories
  • Interpret population projections and their underlying assumptions
  • Analyze how demographic patterns influence future environmental pressures

Population Growth

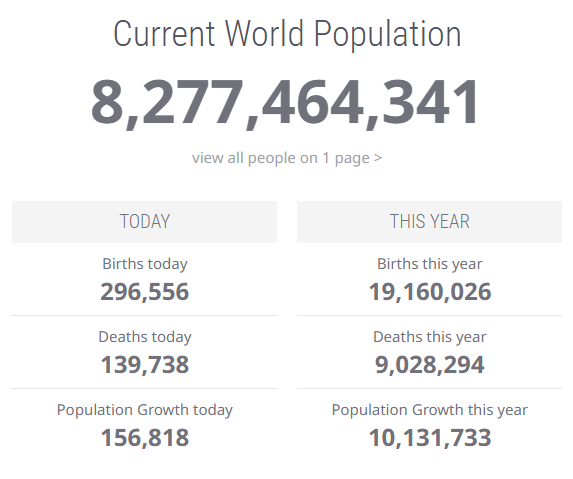
Current Global Population (February 2026)

  • Estimated current global population: ~8.3 billion (Worldometers 2026; UN World Population Prospects 2022 revision)
  • Annual net increase: ~70 million people (~0.9% per year) (UN WPP 2022; Worldometers 2026)
  • Most populous countries:
    • India: ~1.48 billion
    • China: ~1.41 billion
    • United States: ~349 million (Worldometers 2026)
  • Growth unevenly distributed: fastest in sub-Saharan Africa; stable or declining in parts of Europe and East Asia (UN WPP 2022)

Screenshot of the Worldometers website displaying a large headline reading “Current World Population” with a live counter at 8,277,464,341. Below are two columns labeled “Today” and “This Year.” The “Today” column shows births today (296,556), deaths today (139,738), and population growth today (156,818). The “This Year” column shows births this year (19,160,026), deaths this year (9,028,294), and population growth this year (10,131,733).

Worldometers live population counter (February 2026) showing global population at approximately 8.28 billion, with real-time counts of births, deaths, and net population growth for today and this year (Worldometers 2026).

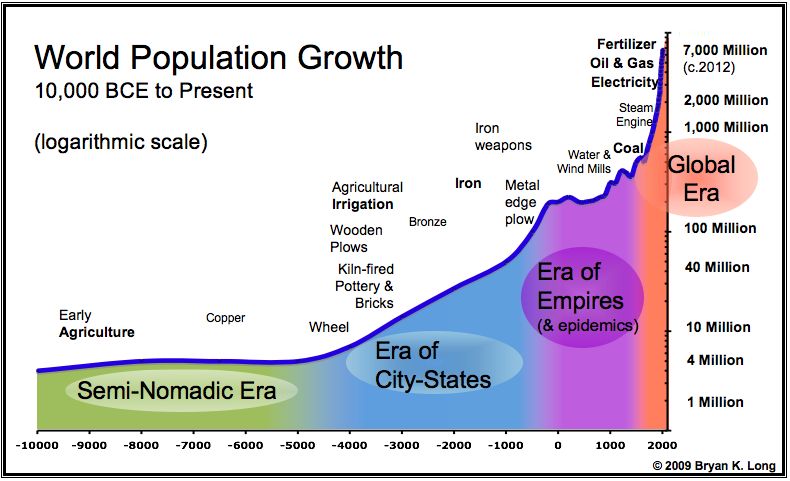
Historical Global Population Growth

  • Population remained very low and stable for most of human history
  • Gradual increase with early agriculture (~10,000 BCE)
  • Accelerating growth during:
    • Agricultural intensification
    • Rise of empires and trade networks
    • Industrial Revolution
  • Sharp exponential increase after ~1800
  • ~8 billion by 2022 (UN World Population Prospects 2022)
  • Estimated total humans ever born: ~117 billion (Population Reference Bureau 2022)

Graph titled “World Population Growth, 10,000 BCE to Present” plotted on a logarithmic scale. The horizontal axis shows time from 10,000 BCE to 2000 CE, and the vertical axis shows population size increasing from 1 million to over 7 billion. The curve remains relatively flat during the Semi-Nomadic Era, rises gradually during the Era of City-States and Era of Empires, and then increases steeply during the Global Era after 1800. Technological milestones such as agriculture, irrigation, metal tools, steam engine, coal, oil, electricity, and fertilizer are marked along the timeline. The sharpest rise occurs after the Industrial Revolution.

World population growth from 10,000 BCE to the present (logarithmic scale), illustrating slow growth during early agricultural and imperial eras followed by rapid acceleration after the Industrial Revolution (Long 2009; https://econosystemics.com/?p=9).

Global Population Growth: Rate vs. Total Size

  • Global population: ~8 billion in 2023
  • Peak global growth rate: ~2.3% in 1963
  • Current growth rate: ~0.9%
  • Growth rate has declined steadily since the 1960s
  • Total population continues to increase despite slowing rate

Key point:
Growth has already peaked — but population size is still rising.

Chart titled “World population growth, 1700–2100.” The green shaded area shows total world population rising from about 600 million in 1700 to 8 billion in 2023, projected to reach about 9.7 billion in 2050 and 10.4 billion in 2086 before stabilizing. A purple line shows the annual population growth rate, which peaks at about 2.3% in 1963 and then declines steadily to about 0.9% in 2023, projected to approach zero or slightly negative by 2100.

World population growth and annual growth rate, 1700–2100, showing peak growth rate in the 1960s and continued increase in total population despite declining growth rates (Our World in Data; UN World Population Prospects 2022 revision).

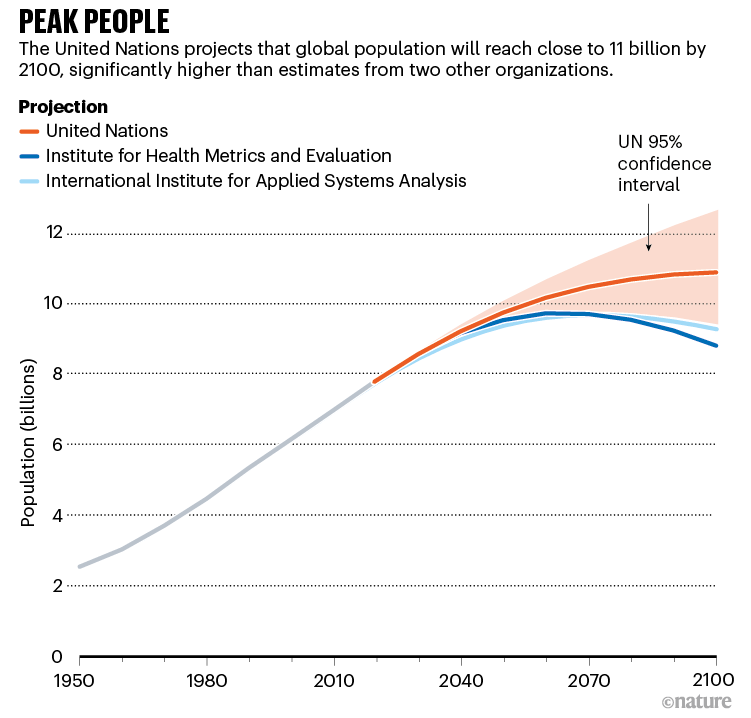
When Will Population Peak?

  • UN World Population Prospects (2024 revision):
    • Peak global population ~10.3 billion
    • Timing: mid-2080s
    • Slight decline or stabilization by 2100
  • Peak timing depends primarily on:
    • Future fertility decline
    • Pace of development and education
    • Regional demographic momentum
  • Different models produce different forecasts:
    • UN: later, higher peak
    • IHME (Lancet): earlier, lower peak (~2060s)

Line graph titled “Peak People” comparing global population projections from 1950 to 2100. The vertical axis shows population in billions from 0 to about 12. Historical population rises from roughly 2.5 billion in 1950 to about 7.8 billion around 2020. After 2020, three projections diverge: the United Nations projection (orange line with shaded 95% confidence interval) rises to nearly 11 billion by 2100; the IHME projection (dark blue line) peaks around mid-century near 9.7–10 billion and then declines to below 9 billion by 2100; and the IIASA projection (light blue line) peaks near mid-century and declines slightly by 2100. The UN projection remains highest by the end of the century.

Projected global population to 2100 from three modeling groups — United Nations, Institute for Health Metrics and Evaluation (IHME), and International Institute for Applied Systems Analysis (IIASA) — showing different peak timing and long-term trajectories (Nature 2021; https://www.nature.com/articles/d41586-021-02522-6).

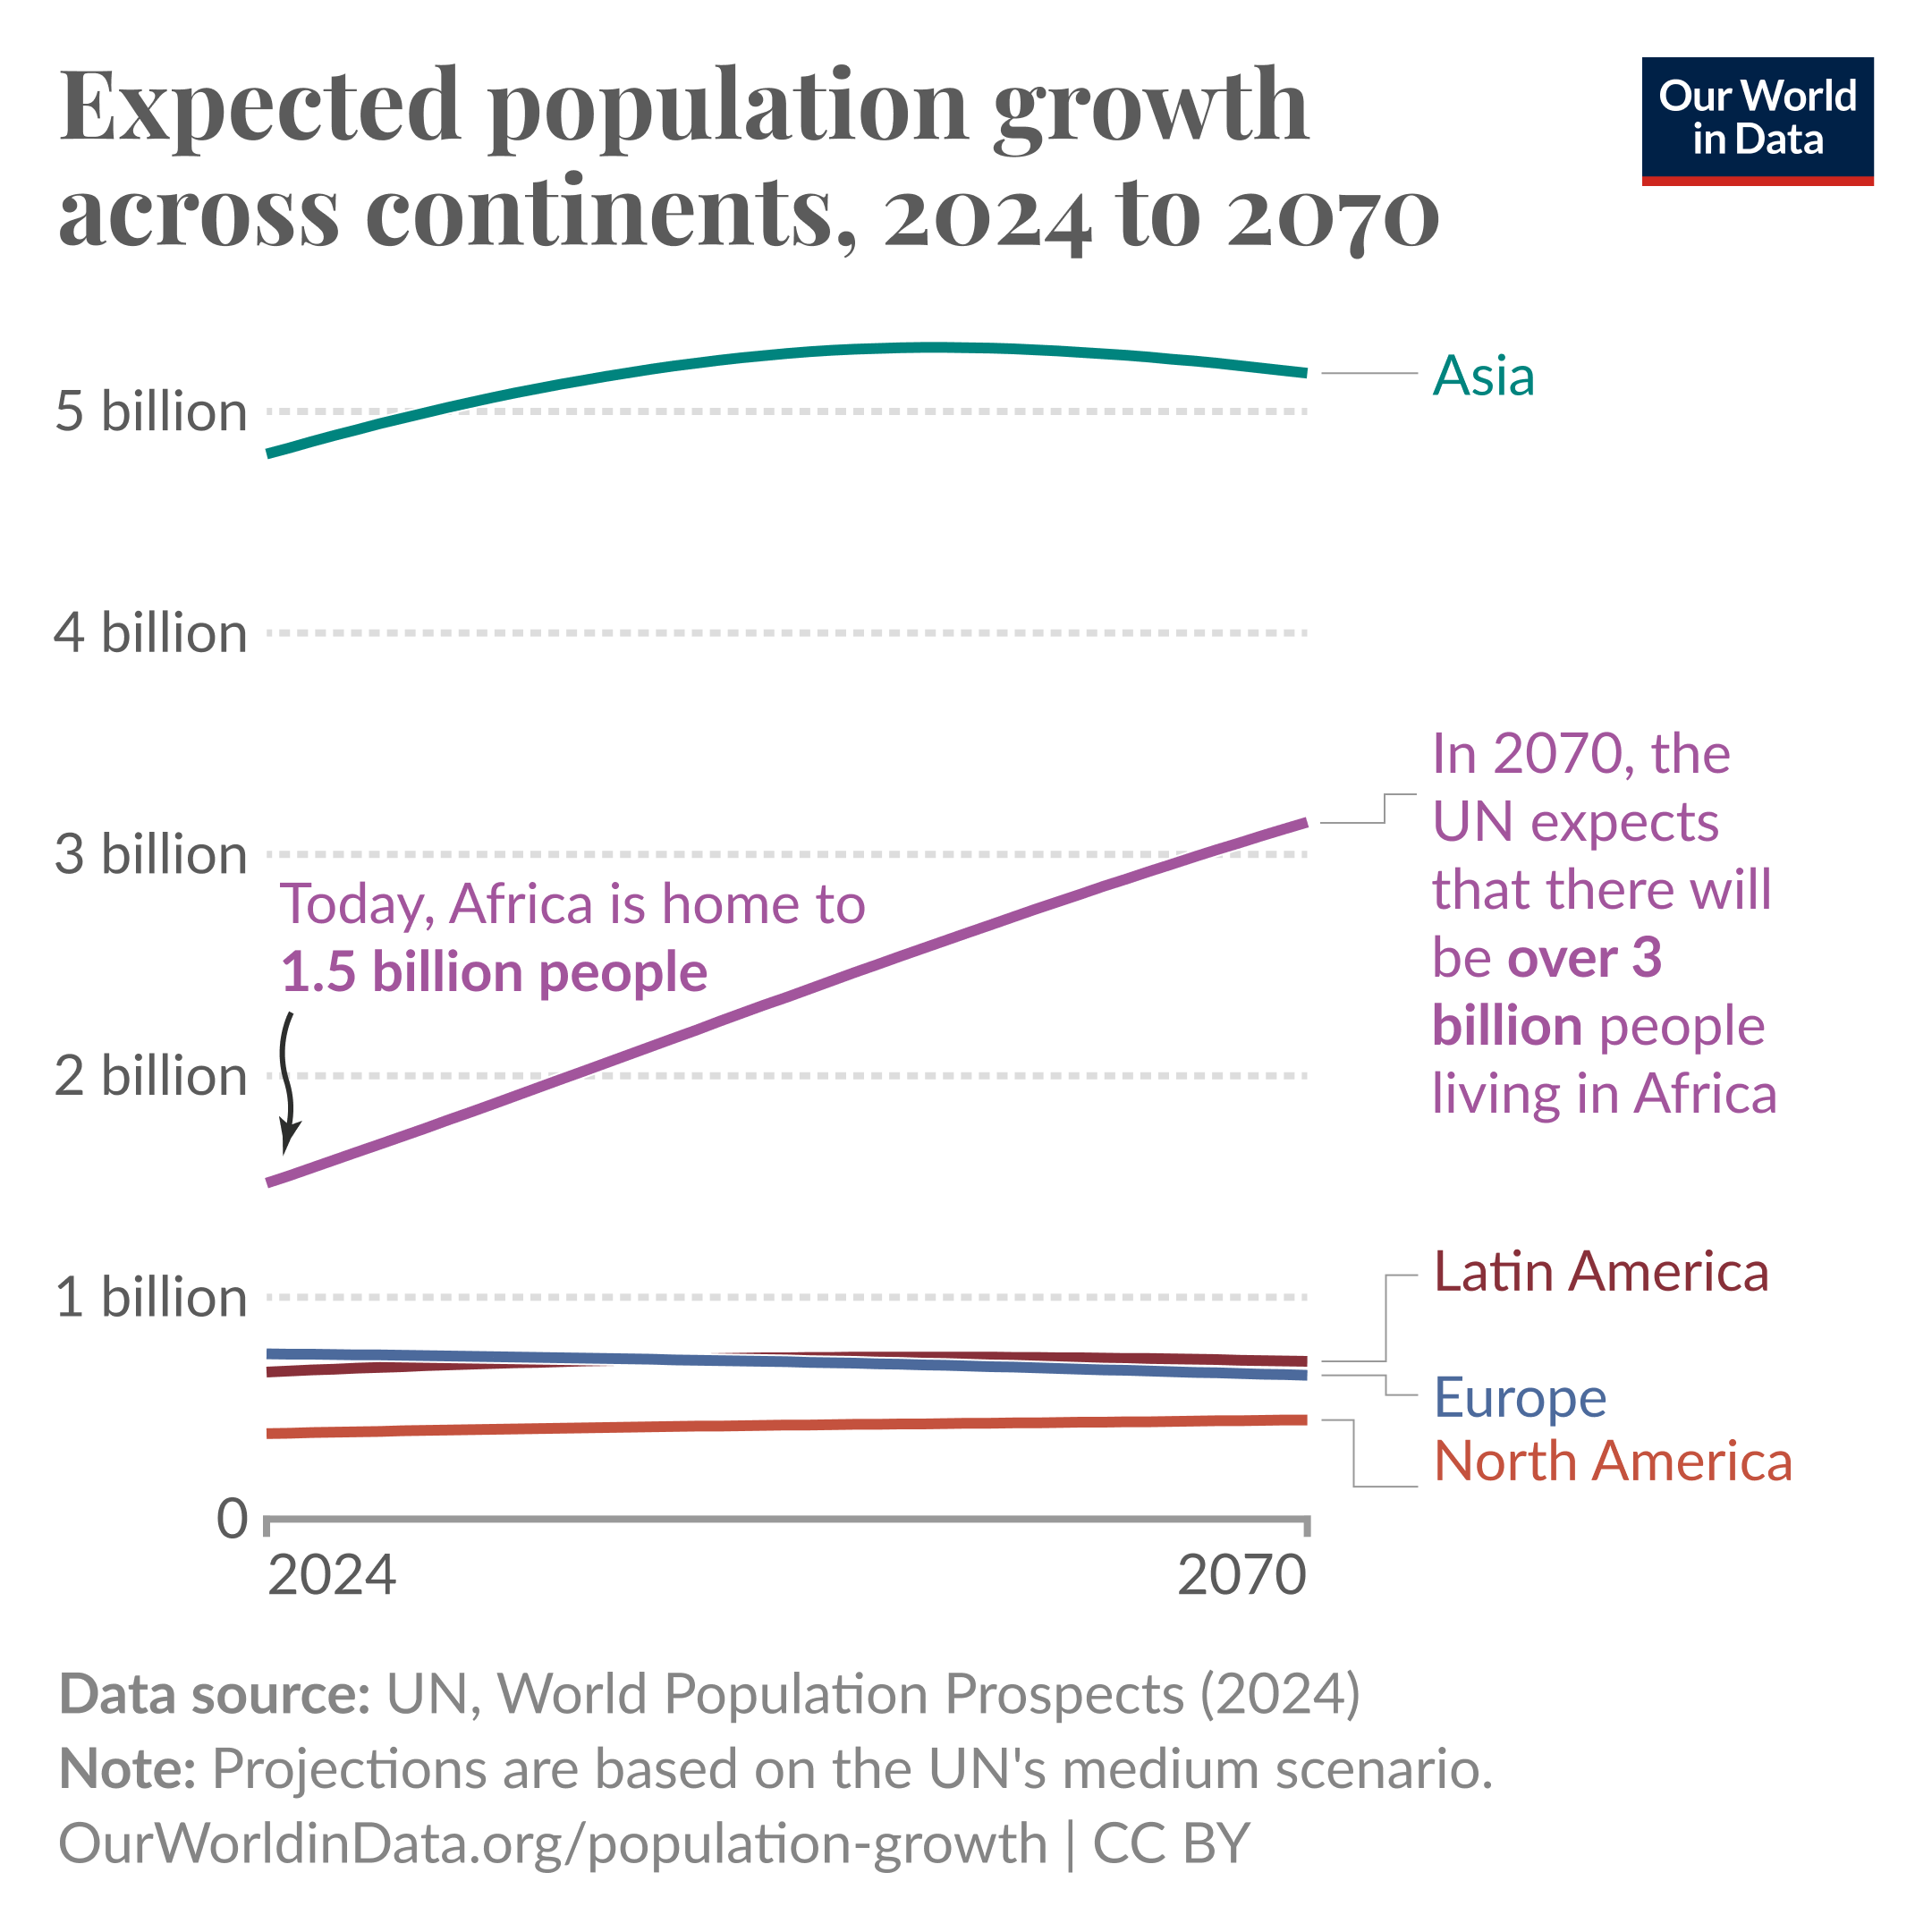
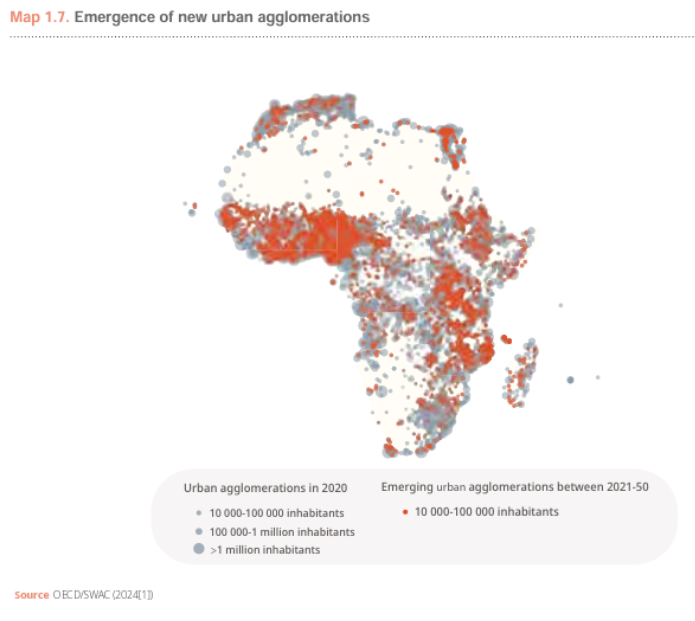
Future global population growth will be geographically uneven

  • Global growth increasingly concentrated in sub-Saharan Africa
    • UN projects Africa’s population will roughly double by ~2070
  • Asia: still largest population, but growth slowing
    • Several countries at or below replacement fertility
  • Europe: stable or declining population
  • Latin America: slowing growth, approaching stabilization
  • North America: modest growth, strongly influenced by migration

Chart illustrating projected population trends by world region to 2100. Sub-Saharan Africa shows steep continued growth, approximately doubling by around 2070. Asia grows more slowly and stabilizes later in the century. Europe shows little growth or gradual decline. Latin America stabilizes mid-century. North America grows modestly. The figure emphasizes that most future global population growth is concentrated in Africa.

Projected regional population change showing rapid growth in sub-Saharan Africa compared with slowing or stabilizing populations in other world regions (UN World Population Prospects 2024; Our World in Data).

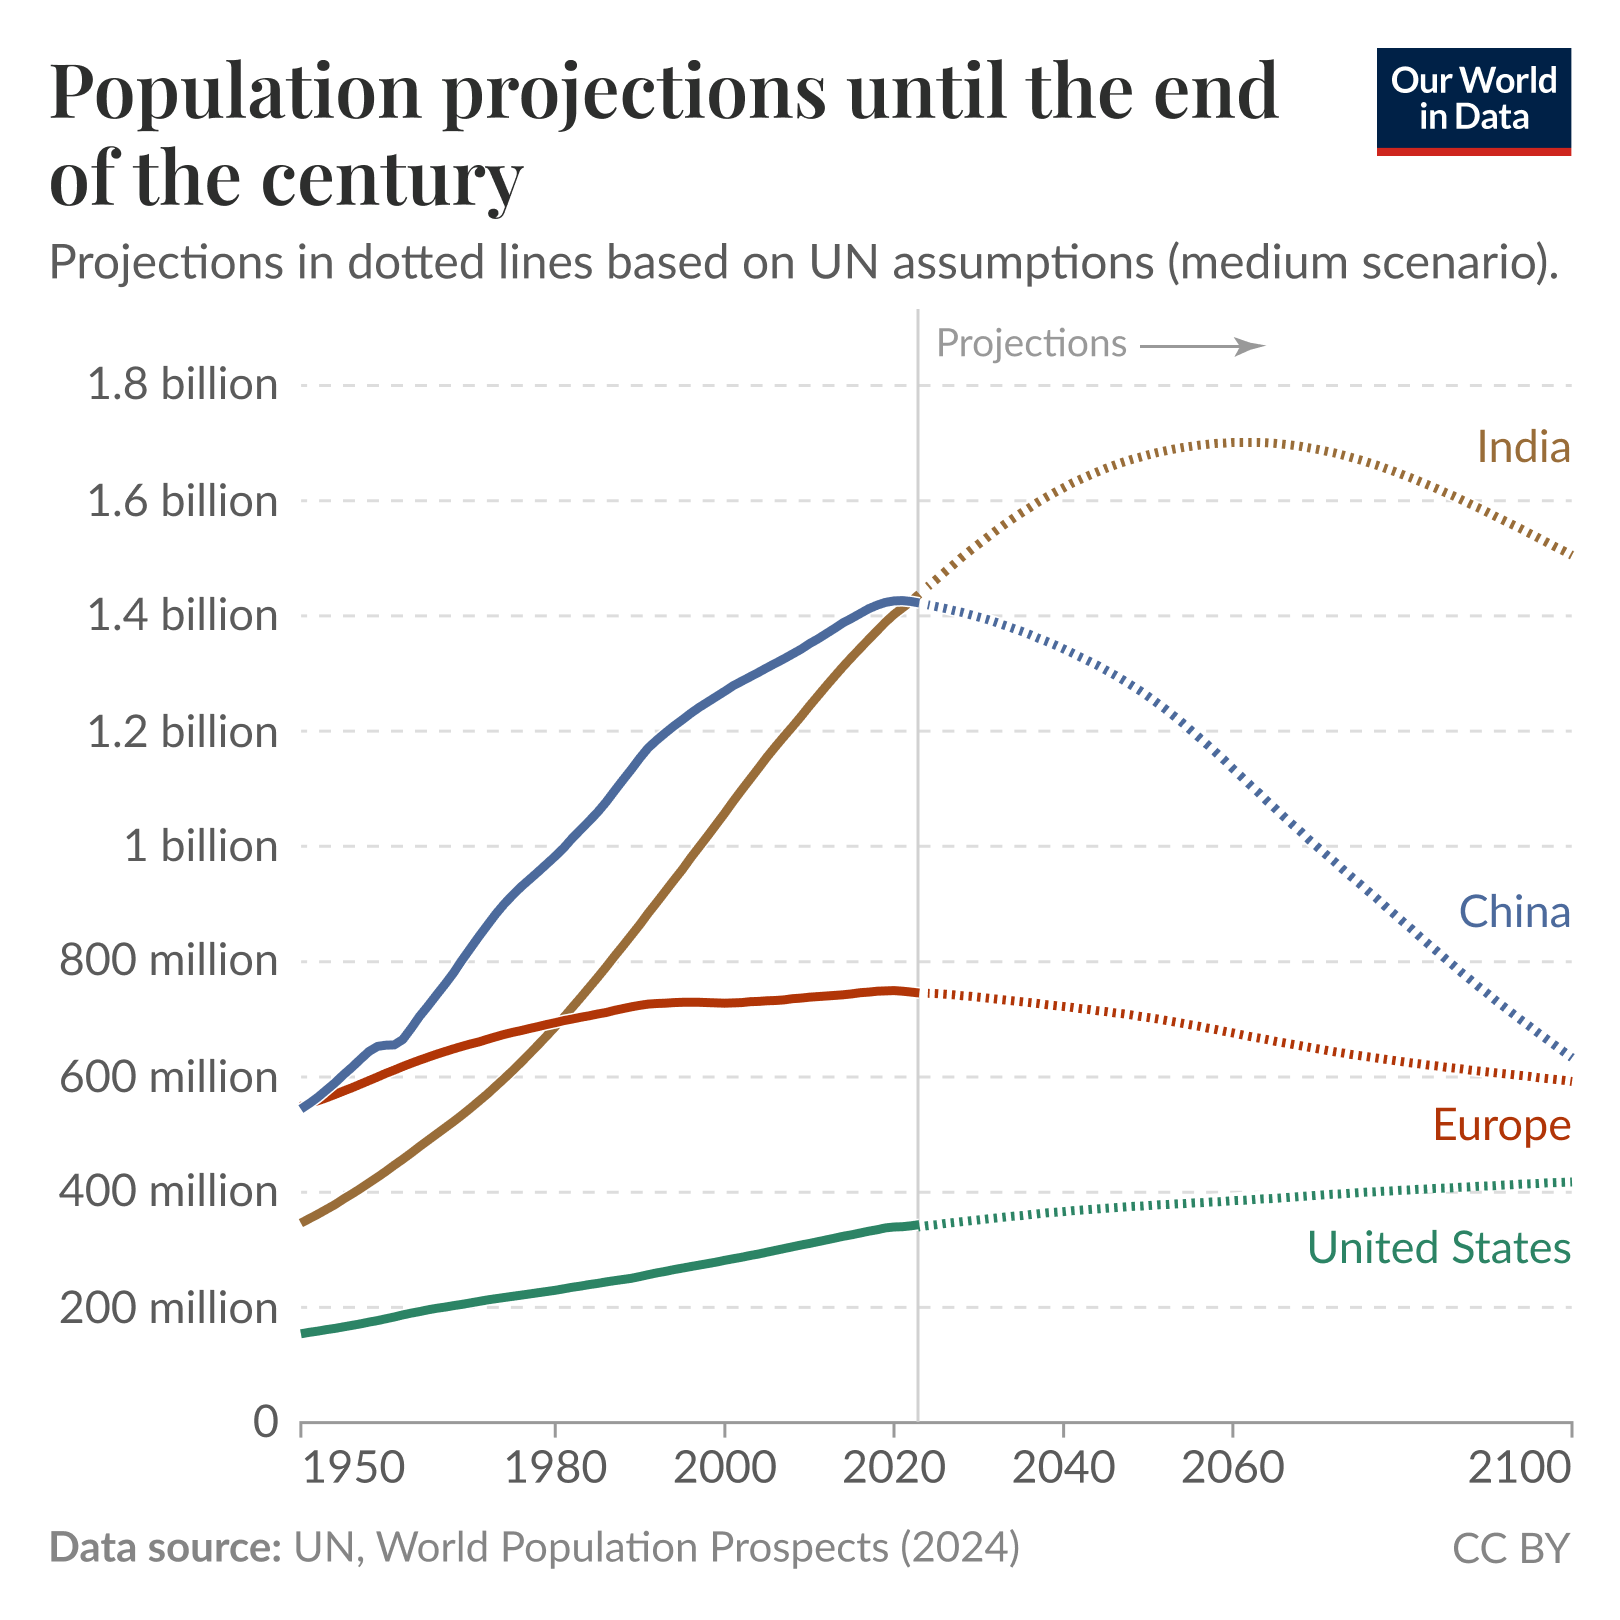
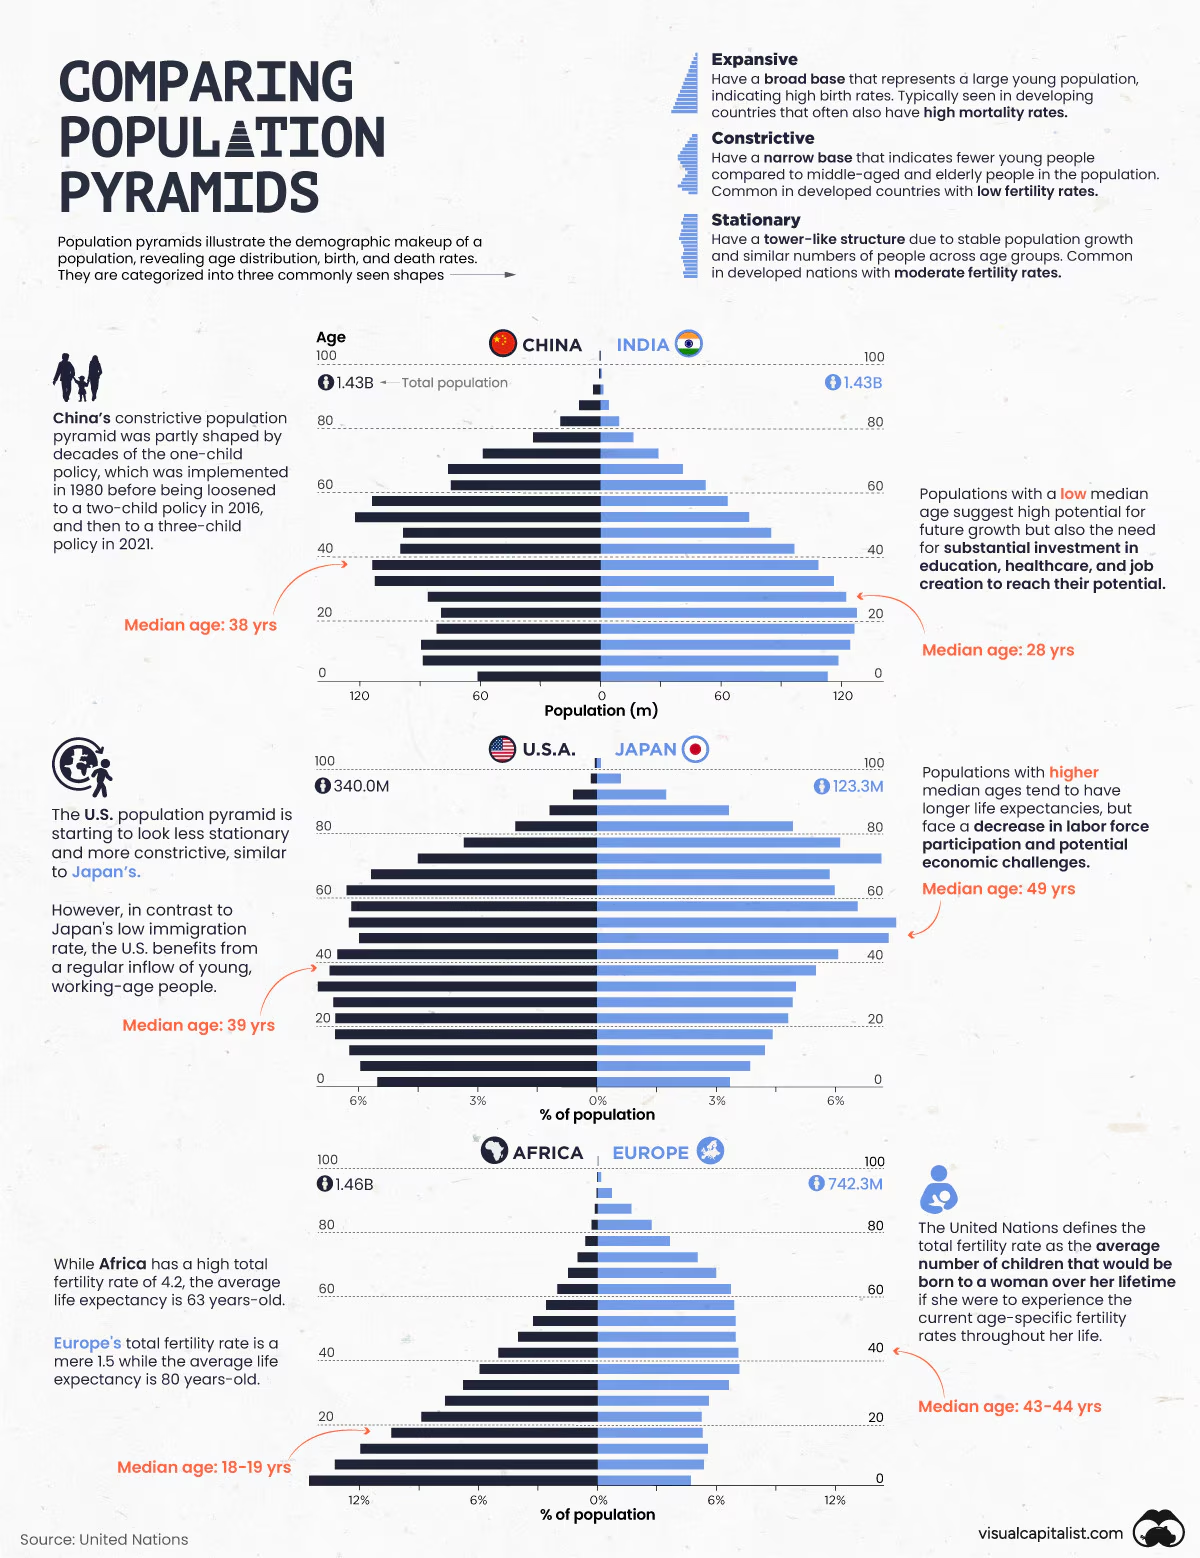
Diverging Population Paths: India, China, Europe, United States

  • India
    • Recently became the world’s most populous country
    • Population still growing, but fertility declining
    • Projected to peak later this century
  • China
    • Population peaked in the early 2020s
    • Rapid aging and projected long-term decline
  • Europe
    • Low fertility for decades
    • Gradual population decline projected
  • United States
    • Slower growth
    • Migration plays major role in stabilizing population

Line chart comparing projected population size from 1950 to 2100 for India, China, Europe, and the United States. India’s population continues rising through mid-century before stabilizing. China’s population peaks in the early 2020s and then declines steadily. Europe shows gradual long-term decline. The United States shows slower, steadier growth with relative stabilization later in the century. The figure highlights divergent demographic futures among major world regions.

Projected population trajectories for India, China, Europe, and the United States, illustrating sharply different timing of peaks and long-term growth or decline (UN World Population Prospects 2024; Our World in Data).

Africa: Rapid Growth

  • Fastest population growth of any world region
  • UN projects population will roughly double by ~2070
  • Median age remains low → large youth population
  • Rapid urbanization underway
  • Growth driven by:
    • Higher fertility in several countries
    • Declining mortality
    • Demographic momentum

Implication:
Africa will account for most global population growth this century.

Asia: Slowing Growth

  • Still the most populous continent
  • Regional fertility has declined substantially
  • Several countries below replacement fertility
  • Population projected to peak mid-century, then stabilize or decline
  • Rapid aging in parts of East Asia

Implication:
Asia’s demographic influence remains large, but growth is slowing.

Country Case: China

  • Population peaked in the early 2020s
  • Fertility well below replacement (~1.0–1.2)
  • Rapid population aging
  • Shrinking workforce projected
  • One-child policy legacy continues to shape demographics

Implication:
Managing aging and economic transition now central challenges.

Country Case: India

  • World’s most populous country
  • Fertility has declined to near replacement (~2.0)
  • Large and youthful population structure
  • Continued growth projected for several decades
  • Rapid urbanization and economic development underway

Implication:
India’s demographic trajectory will strongly influence global totals.

Country Case: United States

  • Moderate population growth
  • Fertility below replacement (~1.6–1.7)
  • Migration plays major role in population stability
  • Aging population, but slower than many European and East Asian countries

Implication:
Future growth depends heavily on immigration policy and economic conditions.

Why Did Population Growth Accelerate?

  • For most of history: high birth rates and high death rates → slow growth
  • After ~1800: death rates declined rapidly → rapid population expansion.

Major drivers:

  • Agricultural intensification (food surplus)
  • Industrial Revolution (energy, mechanization)
  • Improved sanitation and clean water
  • Vaccines and medical advances
  • Declining infant and child mortality
  • Increased life expectancy

Key Takeaways — Population Growth

  • Global population now ~8+ billion
  • Growth rate peaked in the 1960s and has declined
  • Total population continues to rise
  • Future growth concentrated in sub-Saharan Africa
  • Major regions and countries are on very different demographic paths
  • Acceleration driven primarily by declining mortality

Next: What mechanisms determine population change?

Mechanisms of Population Change

Mechanisms of Population Change

Population size changes through three processes:

  • Fertility → births
  • Mortality → deaths
  • Migration → movement across borders

Population change = births − deaths ± net migration

Understanding these mechanisms explains why population grows, stabilizes, or declines.

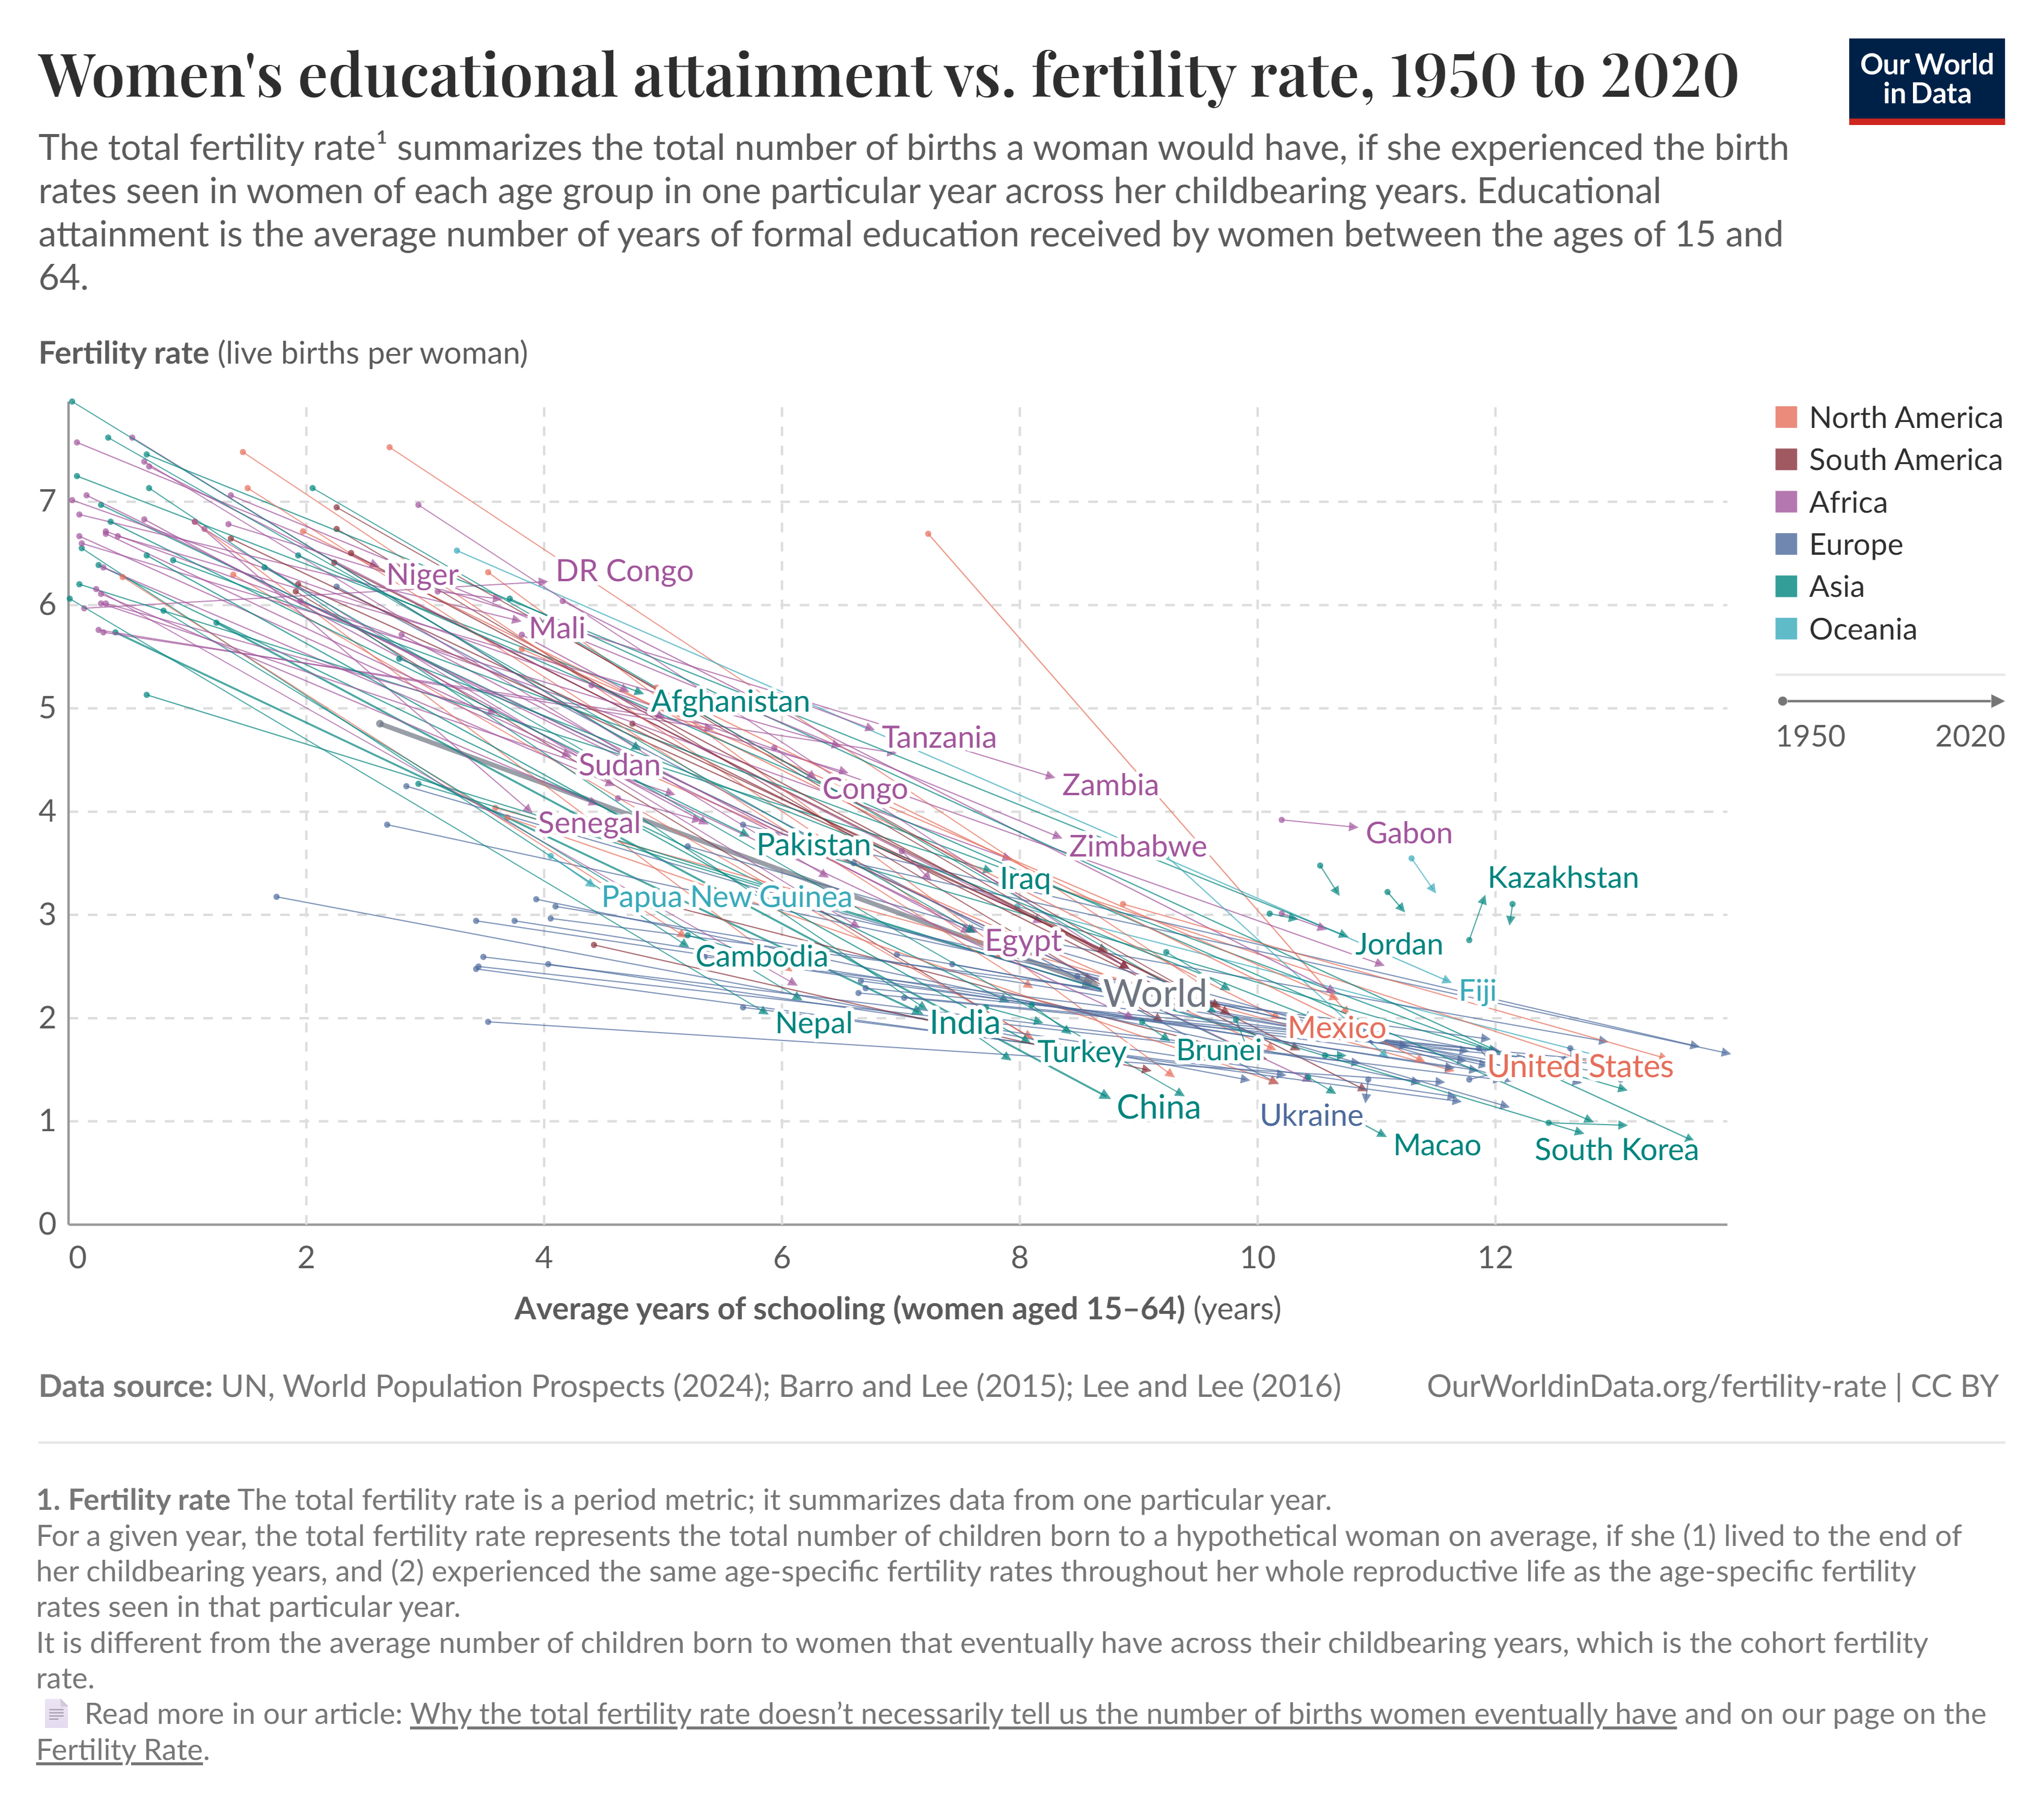
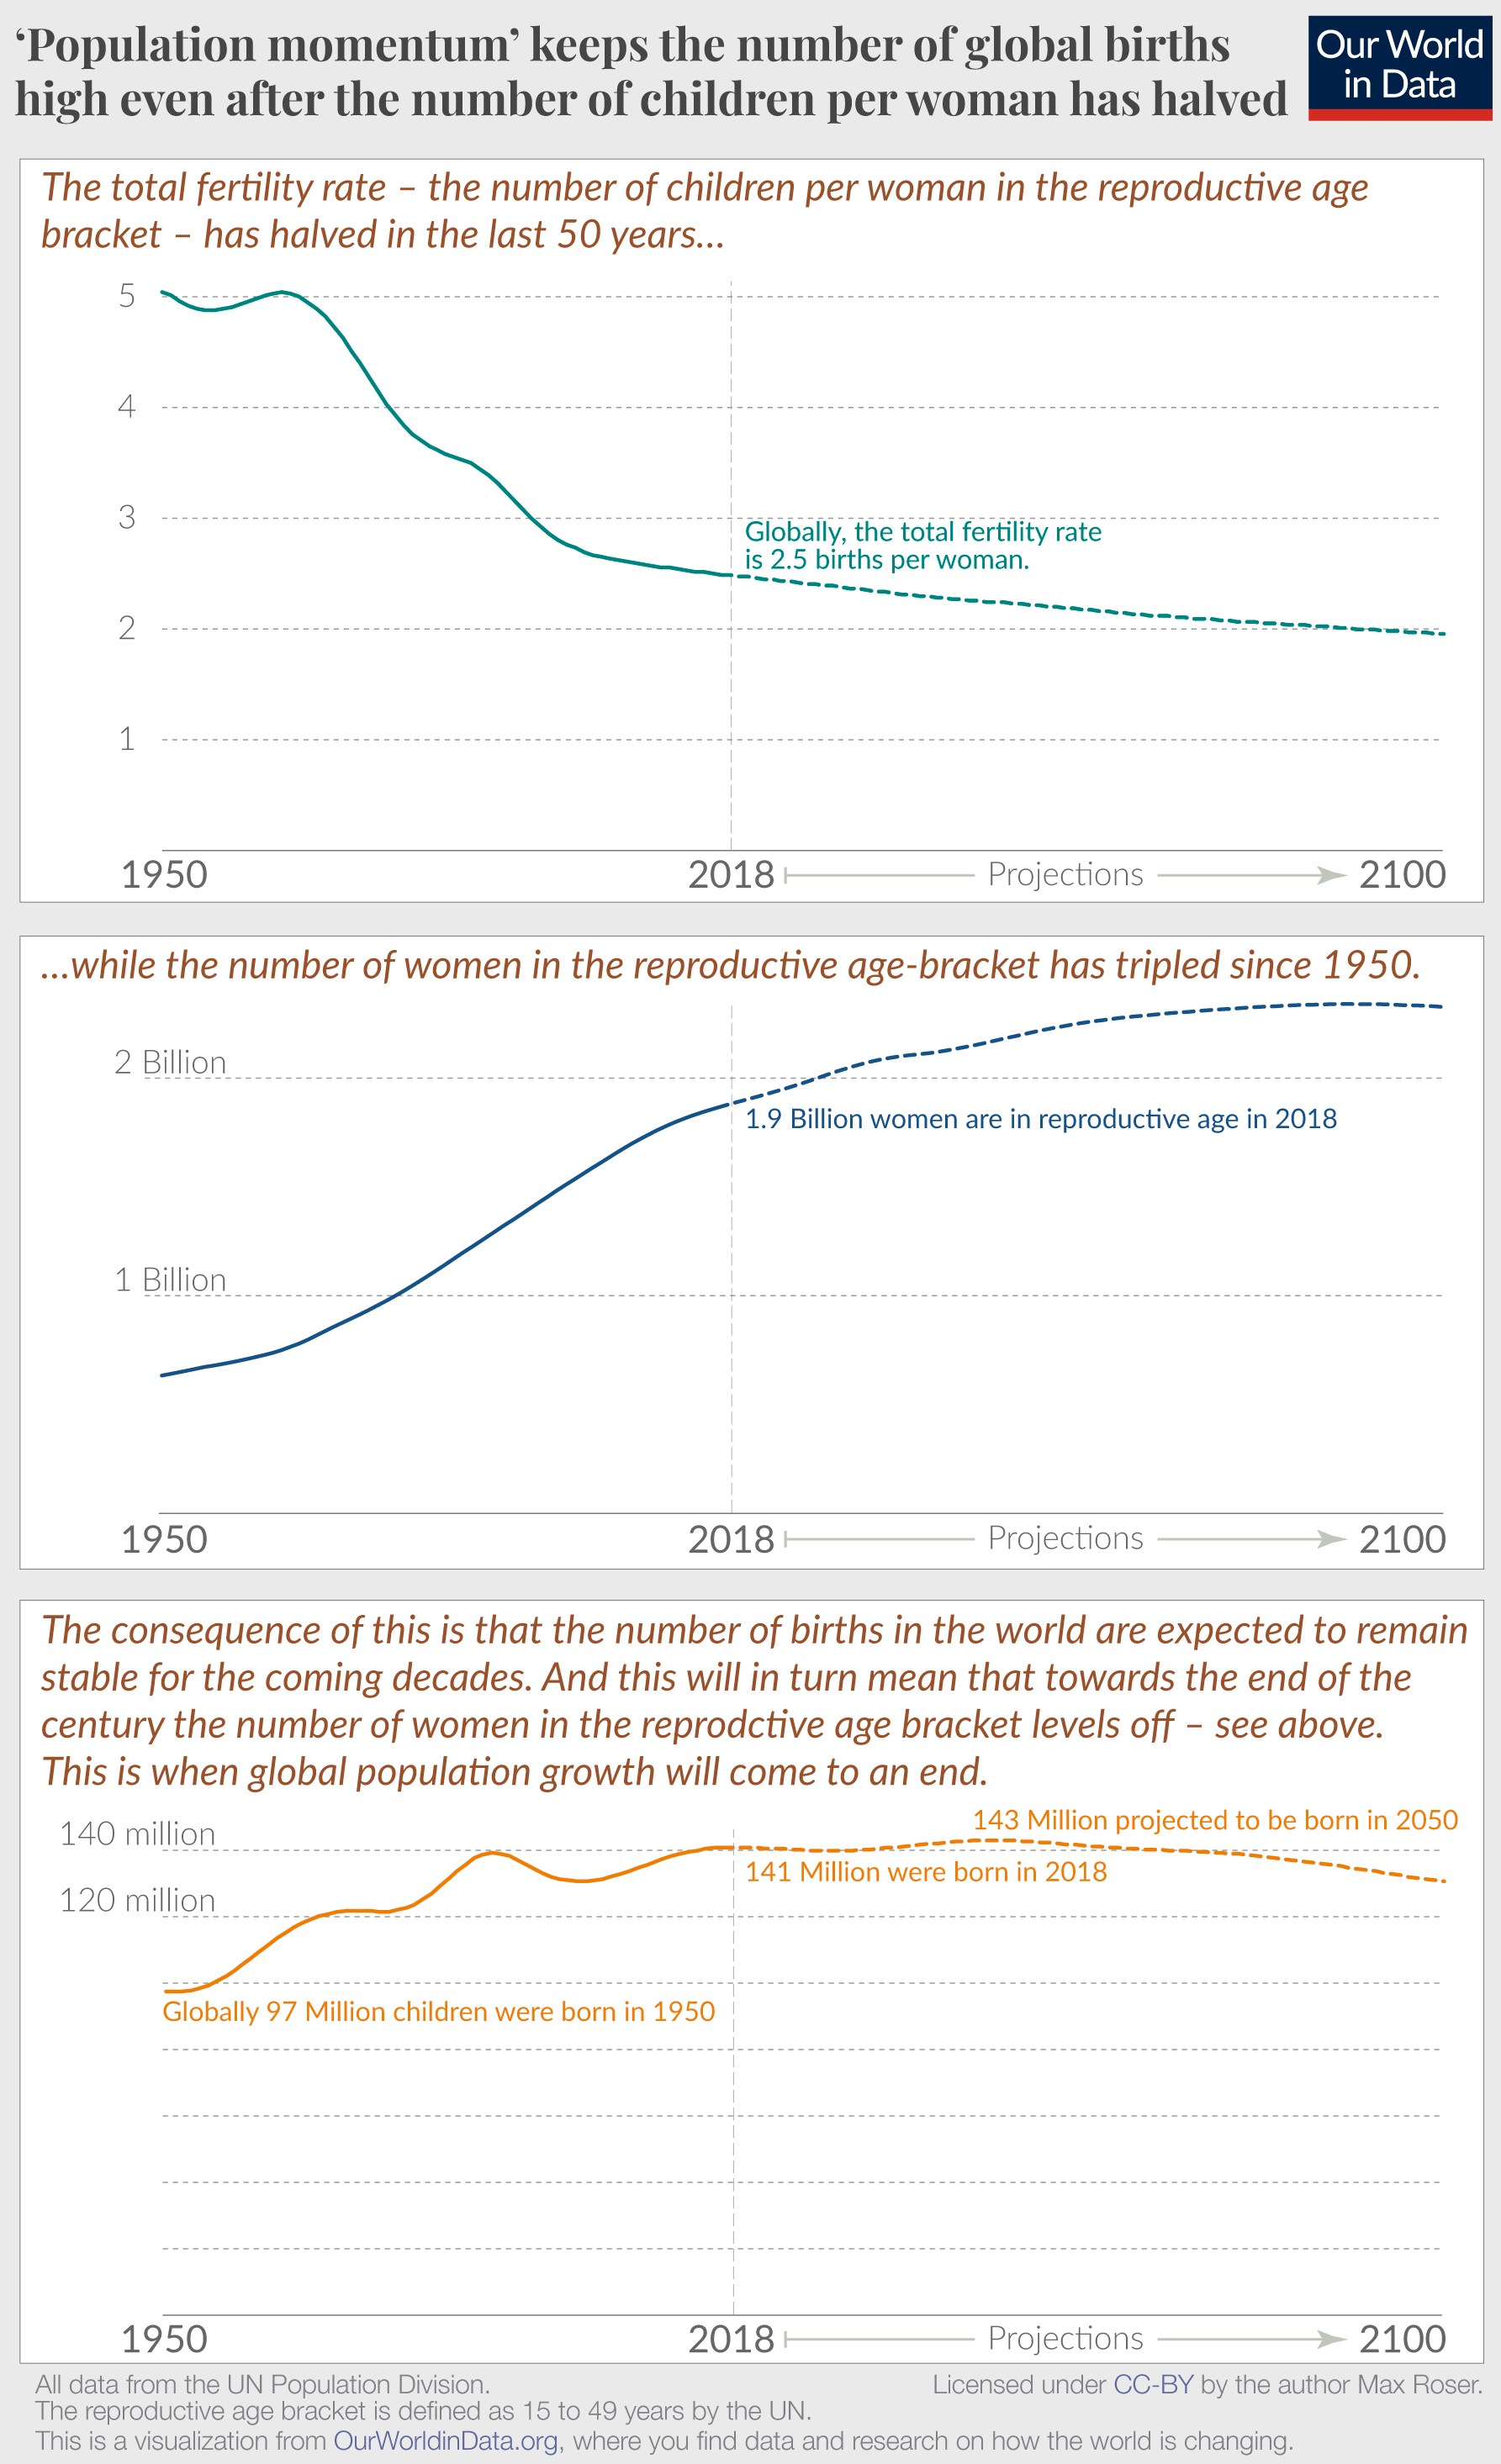
Fertility: average number of children born per woman

  • Measured as Total Fertility Rate (TFR)
  • Global TFR:
    • ~5.0 in 1950
    • ~2.3 today (UN WPP 2024)
  • Influenced by:
    • Education (especially for women)
    • Access to contraception
    • Urbanization
    • Economic opportunity
    • Cultural norms

Lower fertility → slower population growth.

Scatter plot titled “Women’s educational attainment vs. fertility rate, 1950 to 2020.” The horizontal axis shows average years of schooling among women aged 15–64, and the vertical axis shows total fertility rate (children per woman). Each point represents a country-year observation. The overall pattern shows a strong negative relationship: countries where women have few years of schooling tend to have high fertility rates (often above 4–6 children per woman), while countries where women have 10–15 years of schooling tend to have fertility rates near or below replacement level (around 1–2 children per woman). Over time, many countries move rightward (more education) and downward (lower fertility).

Relationship between women’s educational attainment and total fertility rate, 1950–2020, showing that countries with higher average years of schooling for women tend to have lower fertility rates (Our World in Data, based on UN World Population Prospects and Barro-Lee data).

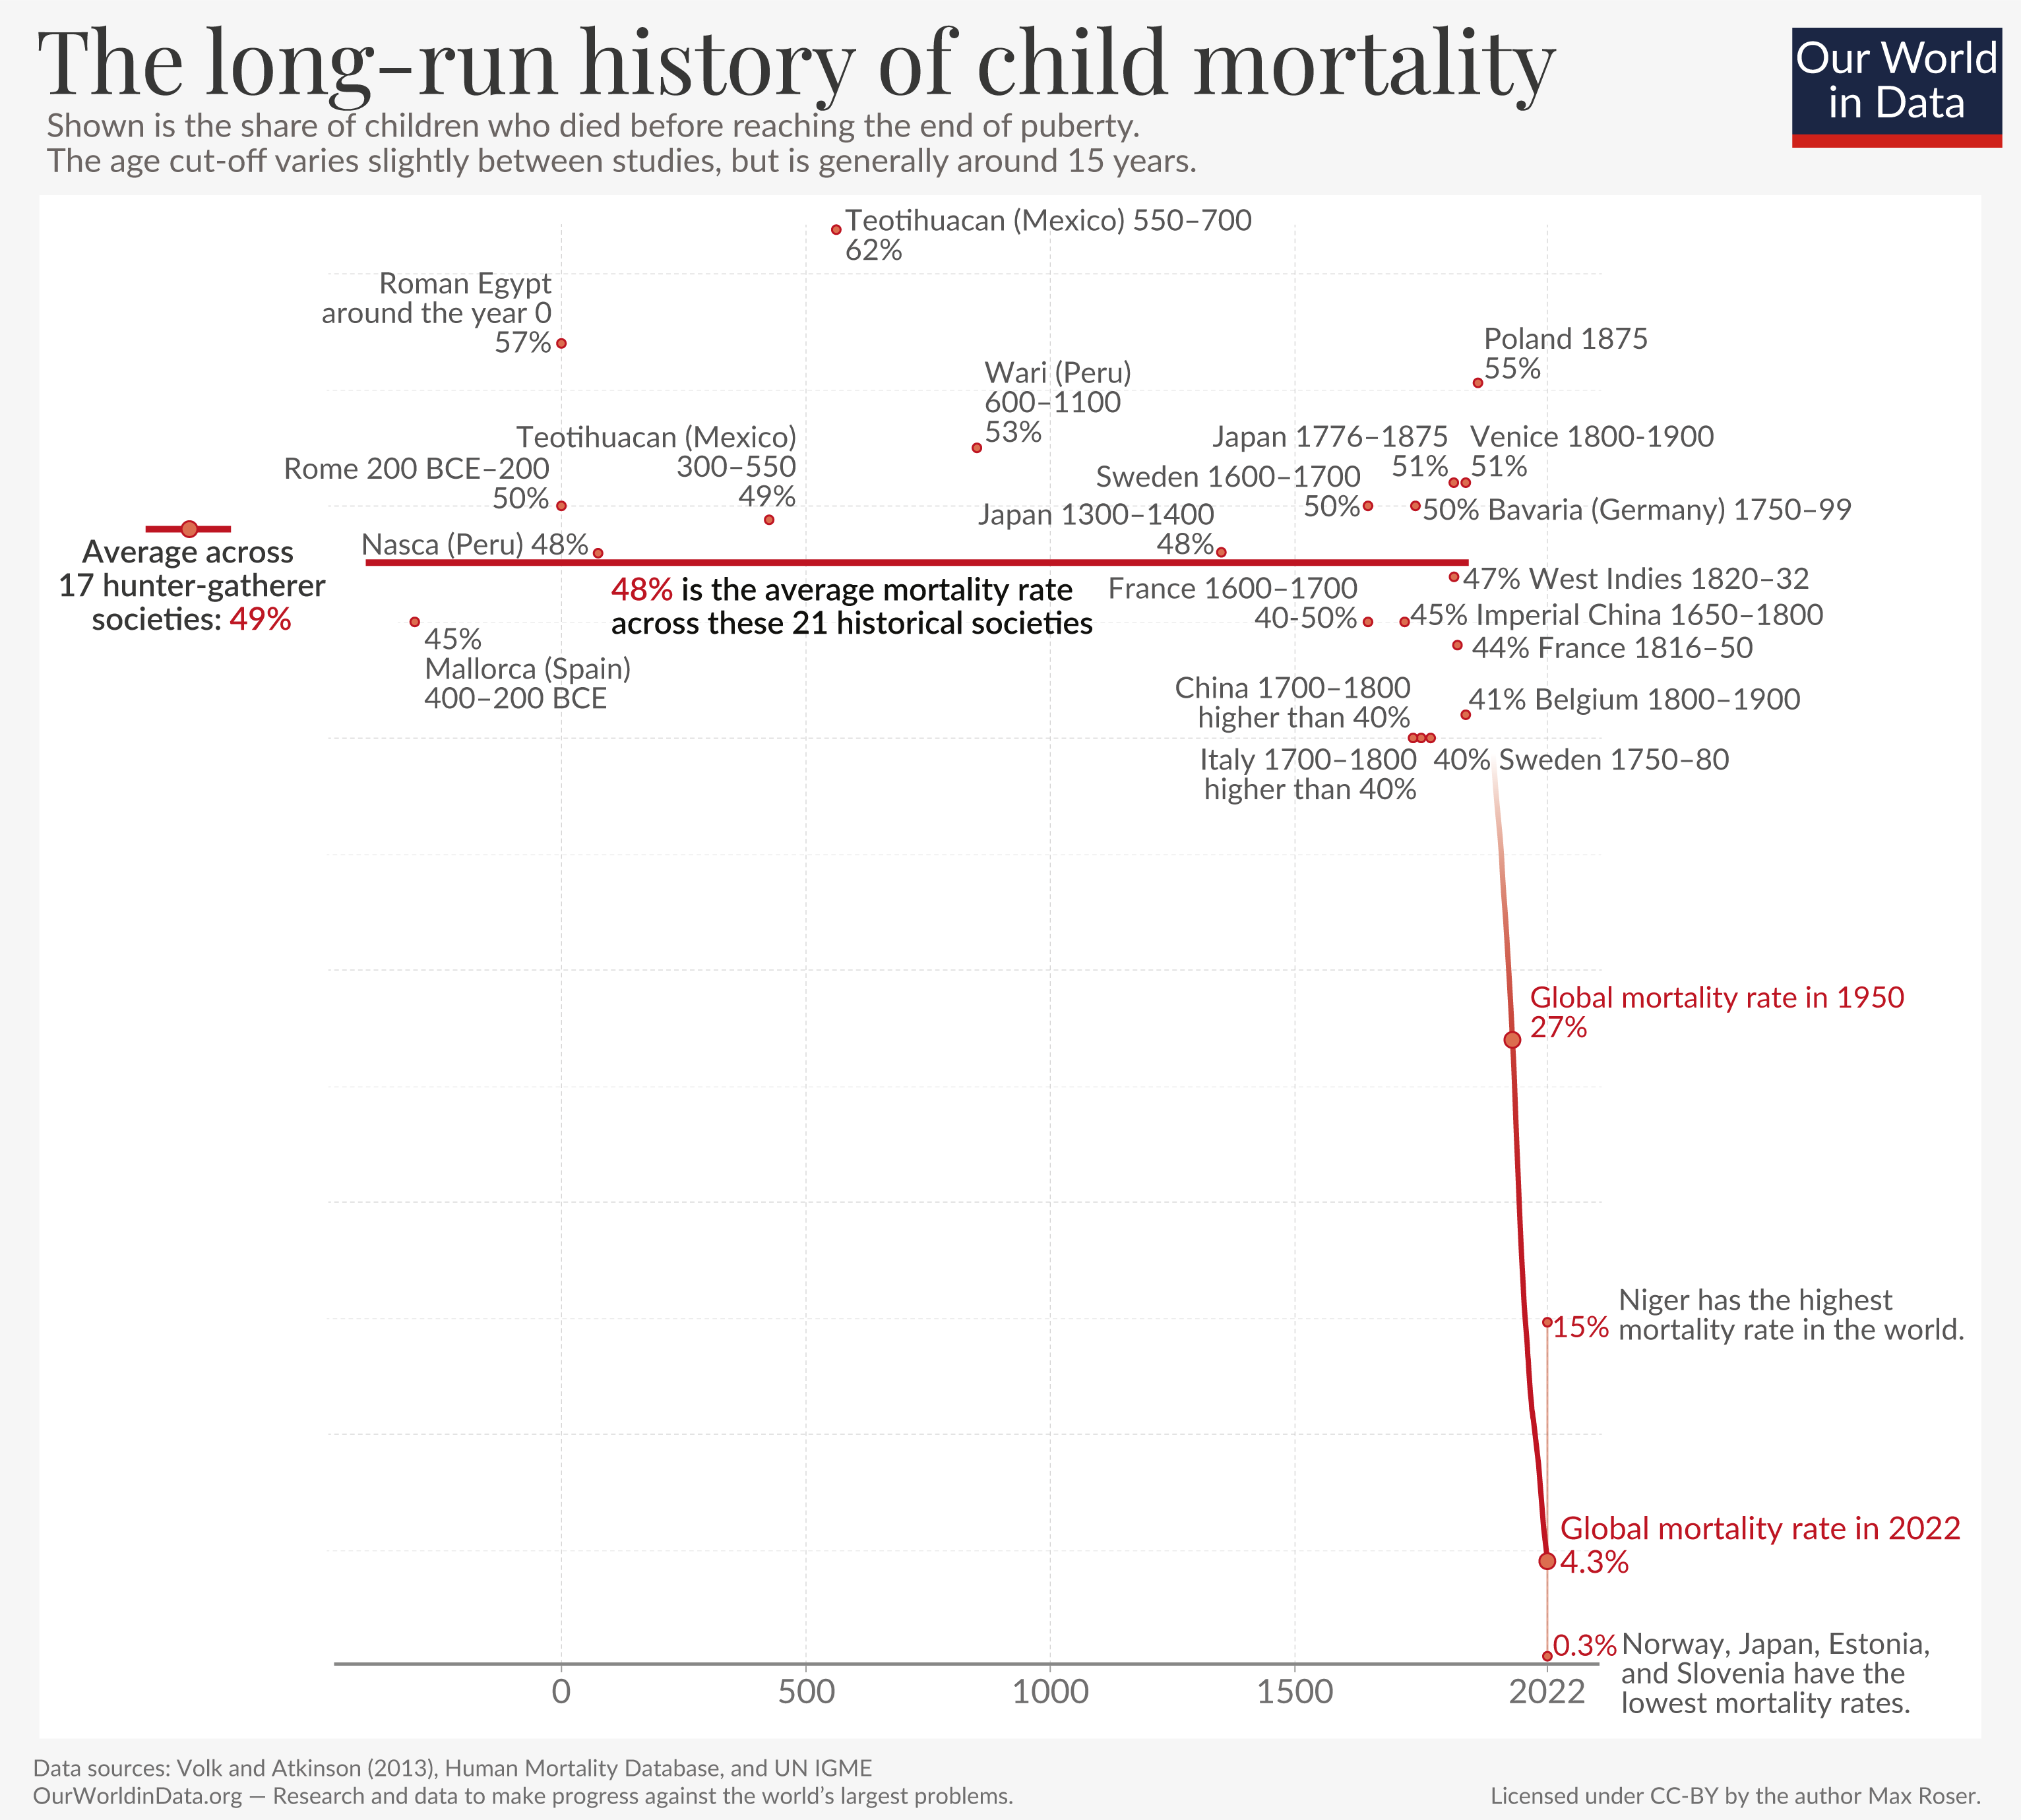
Mortality: number of deaths in a population

  • Measured as death rate or life expectancy
  • Global life expectancy:
    • ~47 years in 1950
    • ~73 years today (World Bank; UN WPP)

Major improvements from:

  • Sanitation and clean water

  • Vaccines and antibiotics

  • Improved nutrition

Declining mortality historically drove rapid population growth.

Line chart showing the share of children who died before age five from 1800 to recent years across multiple world regions. In 1800, child mortality was extremely high in all regions, often around 40–50%. Over the 19th and early 20th centuries, mortality declines gradually in Europe and North America, and more steeply after 1950 worldwide. By the early 21st century, child mortality falls below 5% in high-income regions and declines substantially in Africa, Asia, and Latin America, though rates remain higher in sub-Saharan Africa. The overall pattern shows dramatic global improvement in child survival over time.

Long-run decline in child mortality, showing the share of children dying before age five from 1800 to the present across world regions (Our World in Data, based on UN Inter-agency Group for Child Mortality Estimation and historical demographic data).

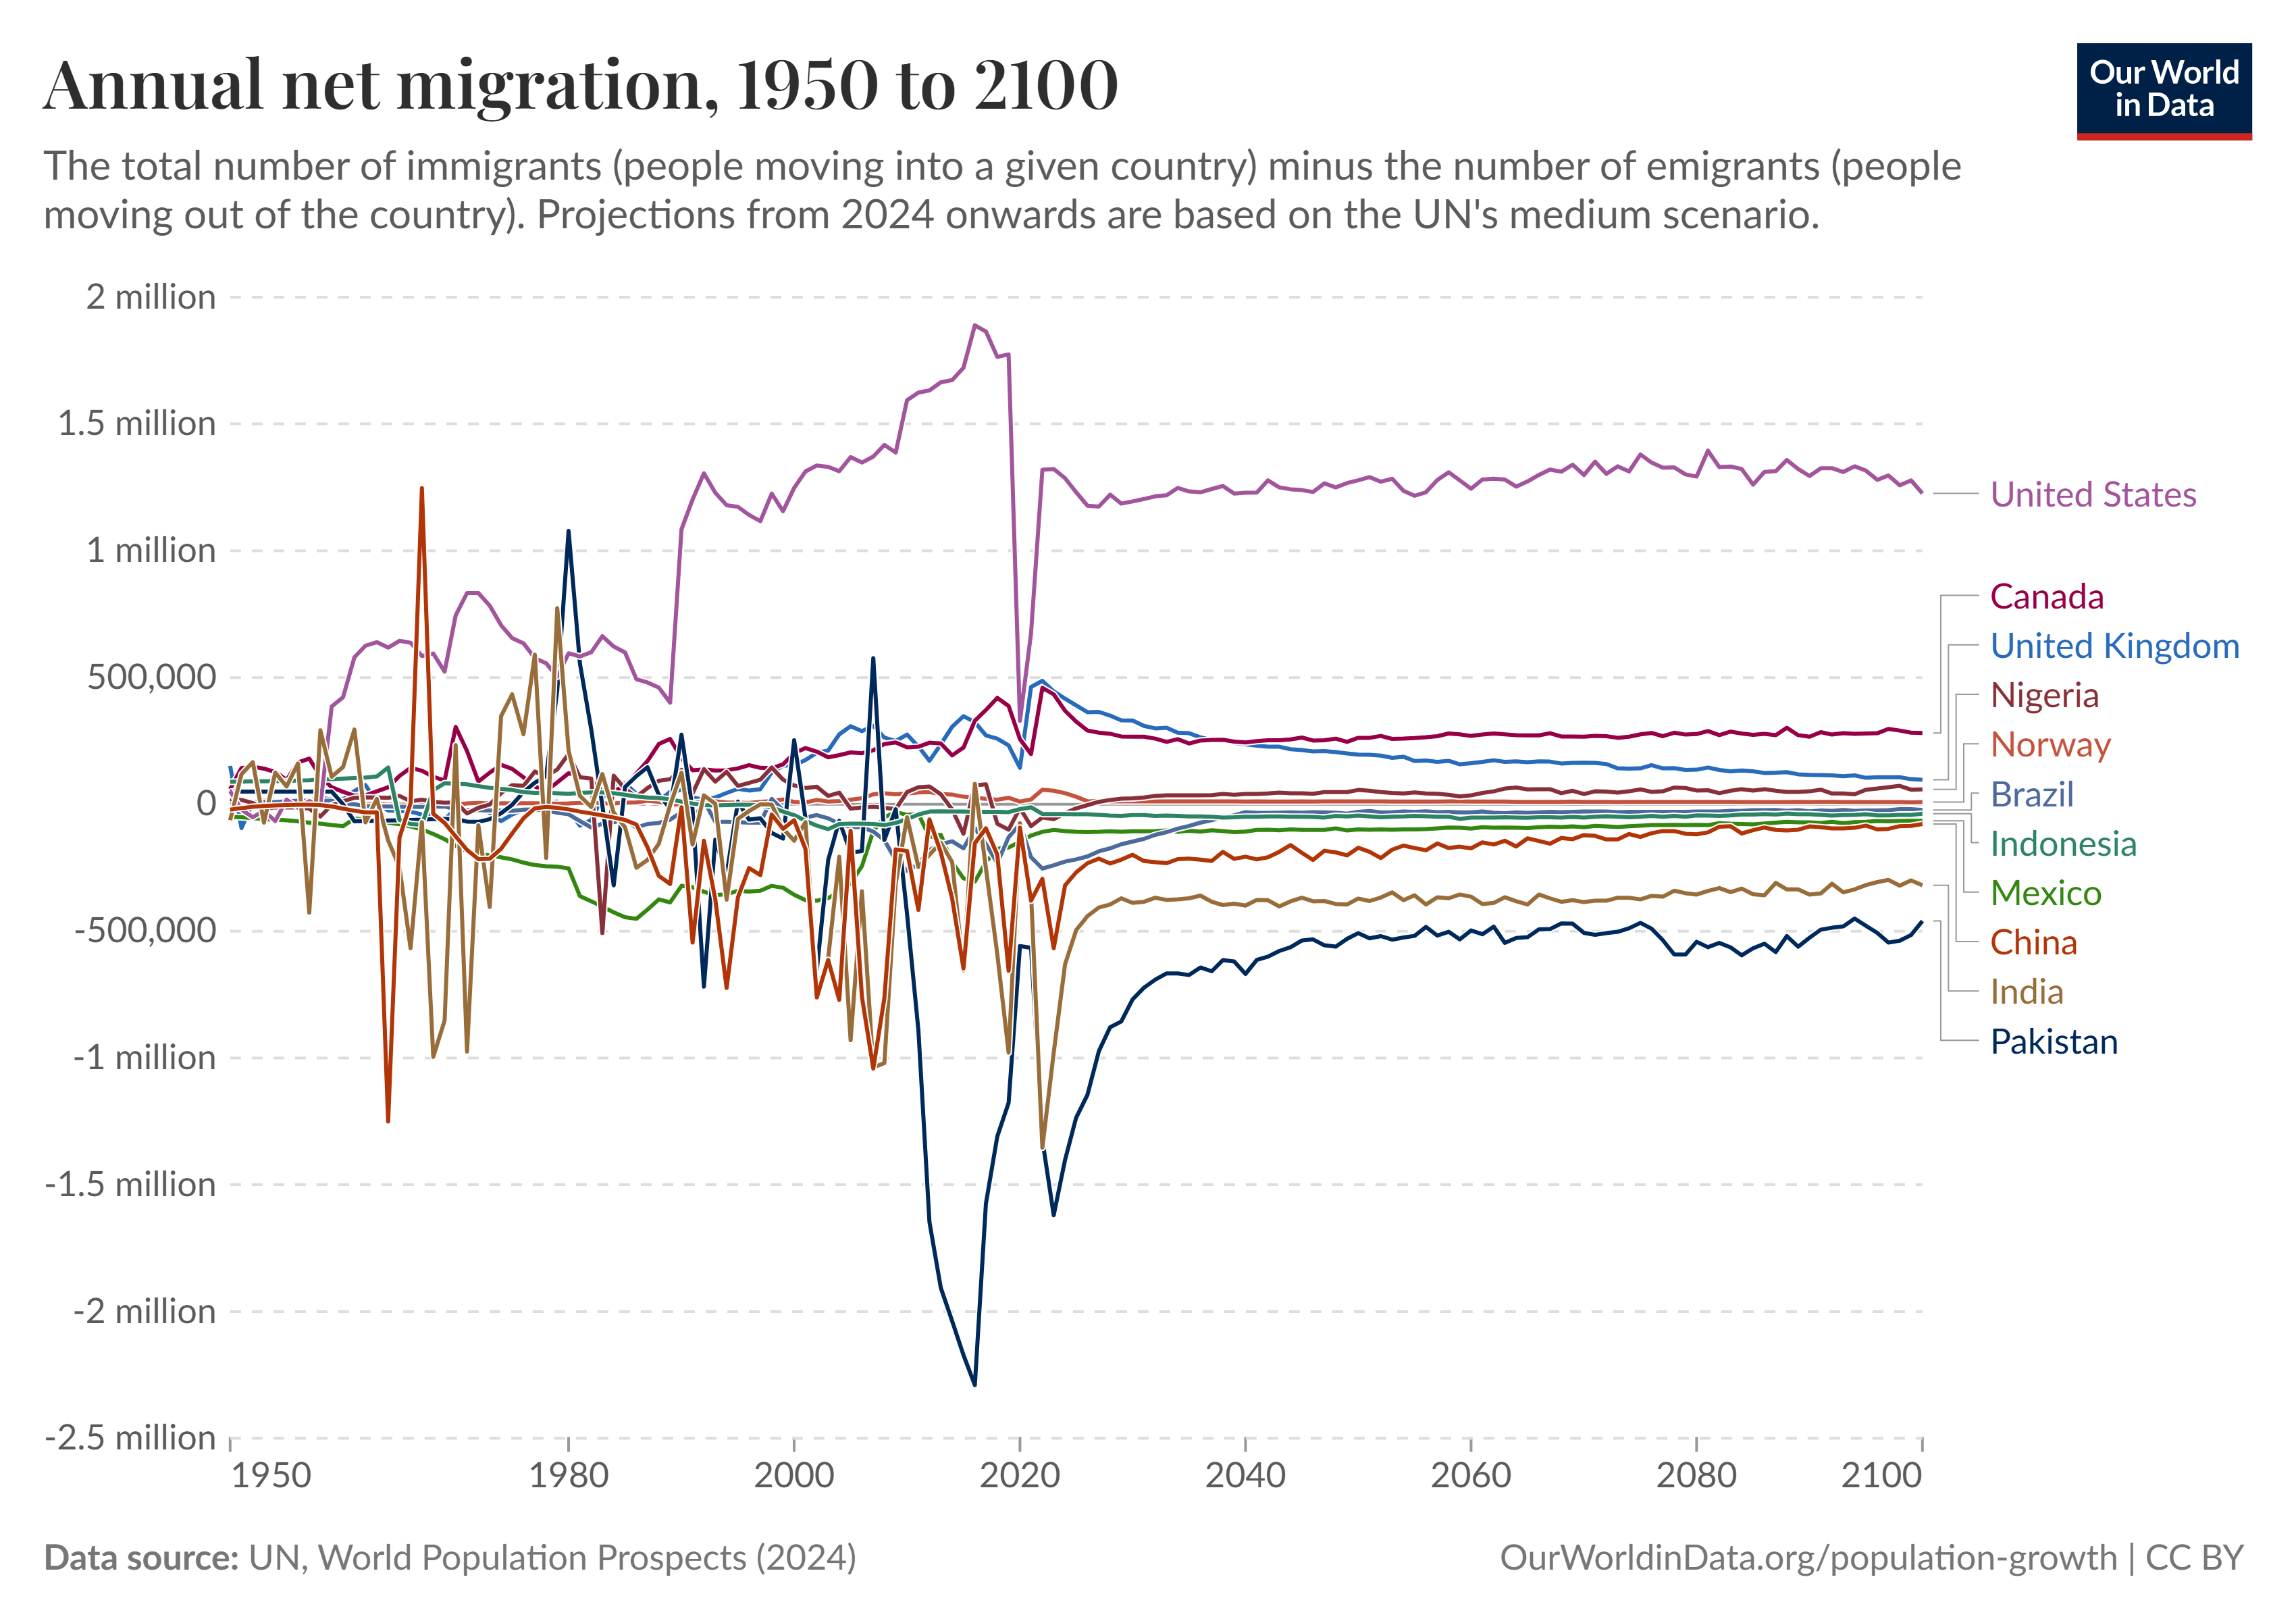
Migration: movement of people between countries

  • Includes:
    • Immigration (inflow)
    • Emigration (outflow)
  • Affects national and regional population size
  • Less important at the global scale
    • Migrants leave one country but enter another

Migration strongly shapes demographic patterns in countries such as the United States and parts of Europe.

Replacement-Level Fertility

  • Replacement-level fertility:
    Average number of children per woman needed to keep population stable
  • In most countries: ~2.1 children per woman
    • 2 to replace parents
    • +0.1 to account for mortality and sex ratio

Important distinction:

  • TFR at replacement does not immediately stop growth
  • Population structure and momentum still matter

Next: Age structure and demographic momentum.

Age Structure

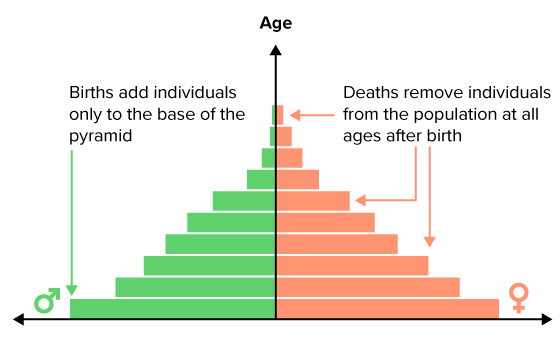
What Is Age Structure?

  • Age structure: distribution of a population across age groups
  • Often divided into:
    • Pre-reproductive (0–14)
    • Reproductive (15–44)
    • Post-reproductive (45+)
    • Male vs. female (left/right)
  • Strong predictor of future population growth or decline
  • Even if fertility changes, age structure shapes future trajectory

A population pyramid, with each bar representing an age class and the width of the bar representing the population size in that age class. Source: flexbooks.ck12.org / Douglass Wilkin and Jean Brainard

A population pyramid, with each bar representing an age class and the width of the bar representing the population size in that age class. Source: flexbooks.ck12.org / Douglass Wilkin and Jean Brainard

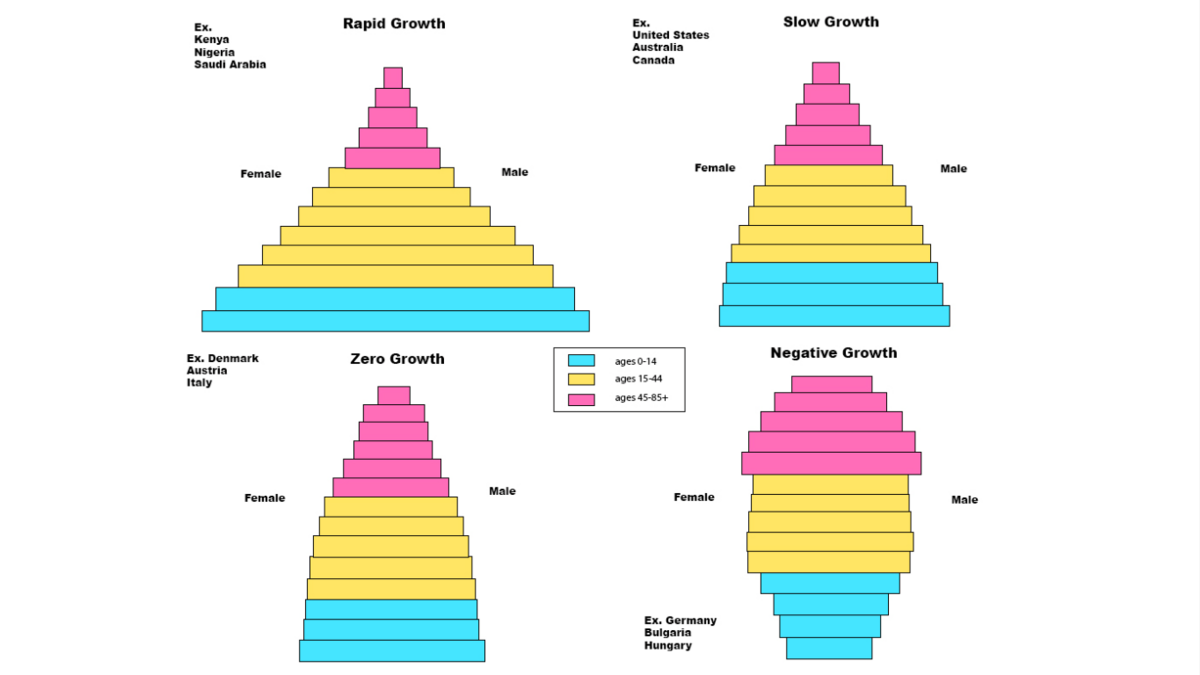
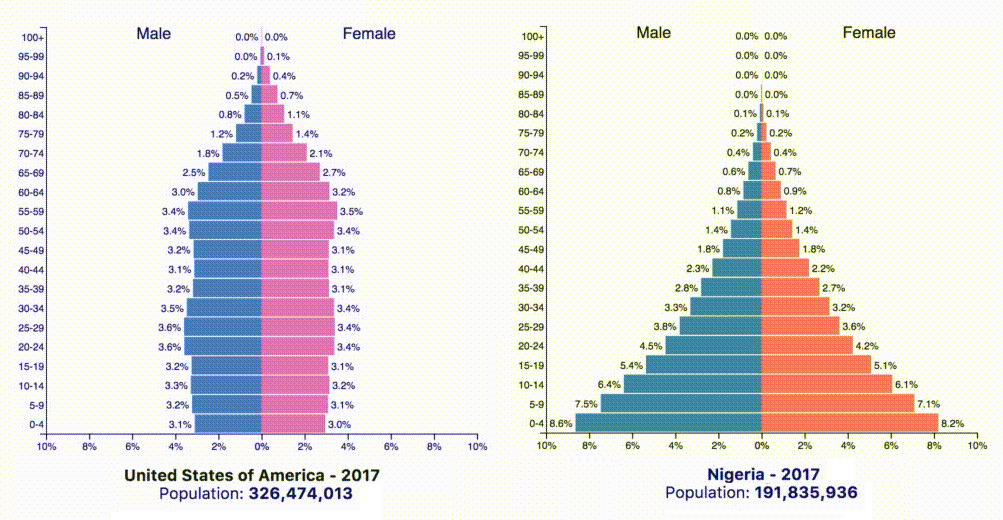
Population Pyramids: Expanding, Stable, Contracting

  • Expanding structure
    • Wide base
    • Large youth population
    • Future growth likely
  • Stable structure
    • Rectangular shape
    • Similar numbers across age groups
  • Contracting structure
    • Narrow base
    • Larger older population
    • Likely decline

How to Read a Population Pyramid

  • Horizontal axis → population size (male / female)
  • Vertical axis → age groups
  • Wide base → high fertility
  • Bulge in middle → large working-age cohort
  • Wide top → aging population
  • Shape indicates long-term demographic direction

Youth Bulge vs. Aging Population

  • Youth bulge
    • Large proportion under age 15
    • Strong future population momentum
    • High demand for education and jobs
  • Aging population
    • Large proportion over age 65
    • Rising dependency ratios
    • Increased healthcare and pension pressures

Age structure influences economic and social systems.

The Demographic Transition Model

  • Describes how population changes as societies develop economically

Stage 1 — Preindustrial - High birth rates, high death rates
- Slow population growth

Stage 2 — Transitional - Death rates decline (sanitation, medicine, food supply)
- Birth rates remain high
- Rapid population growth

Stage 3 — Industrial - Birth rates decline
- Growth slows

Stage 4-5 — Postindustrial - Low birth and death rates
- Stable or declining population

Many countries are now in Stages 3–5.

OWID

OWID

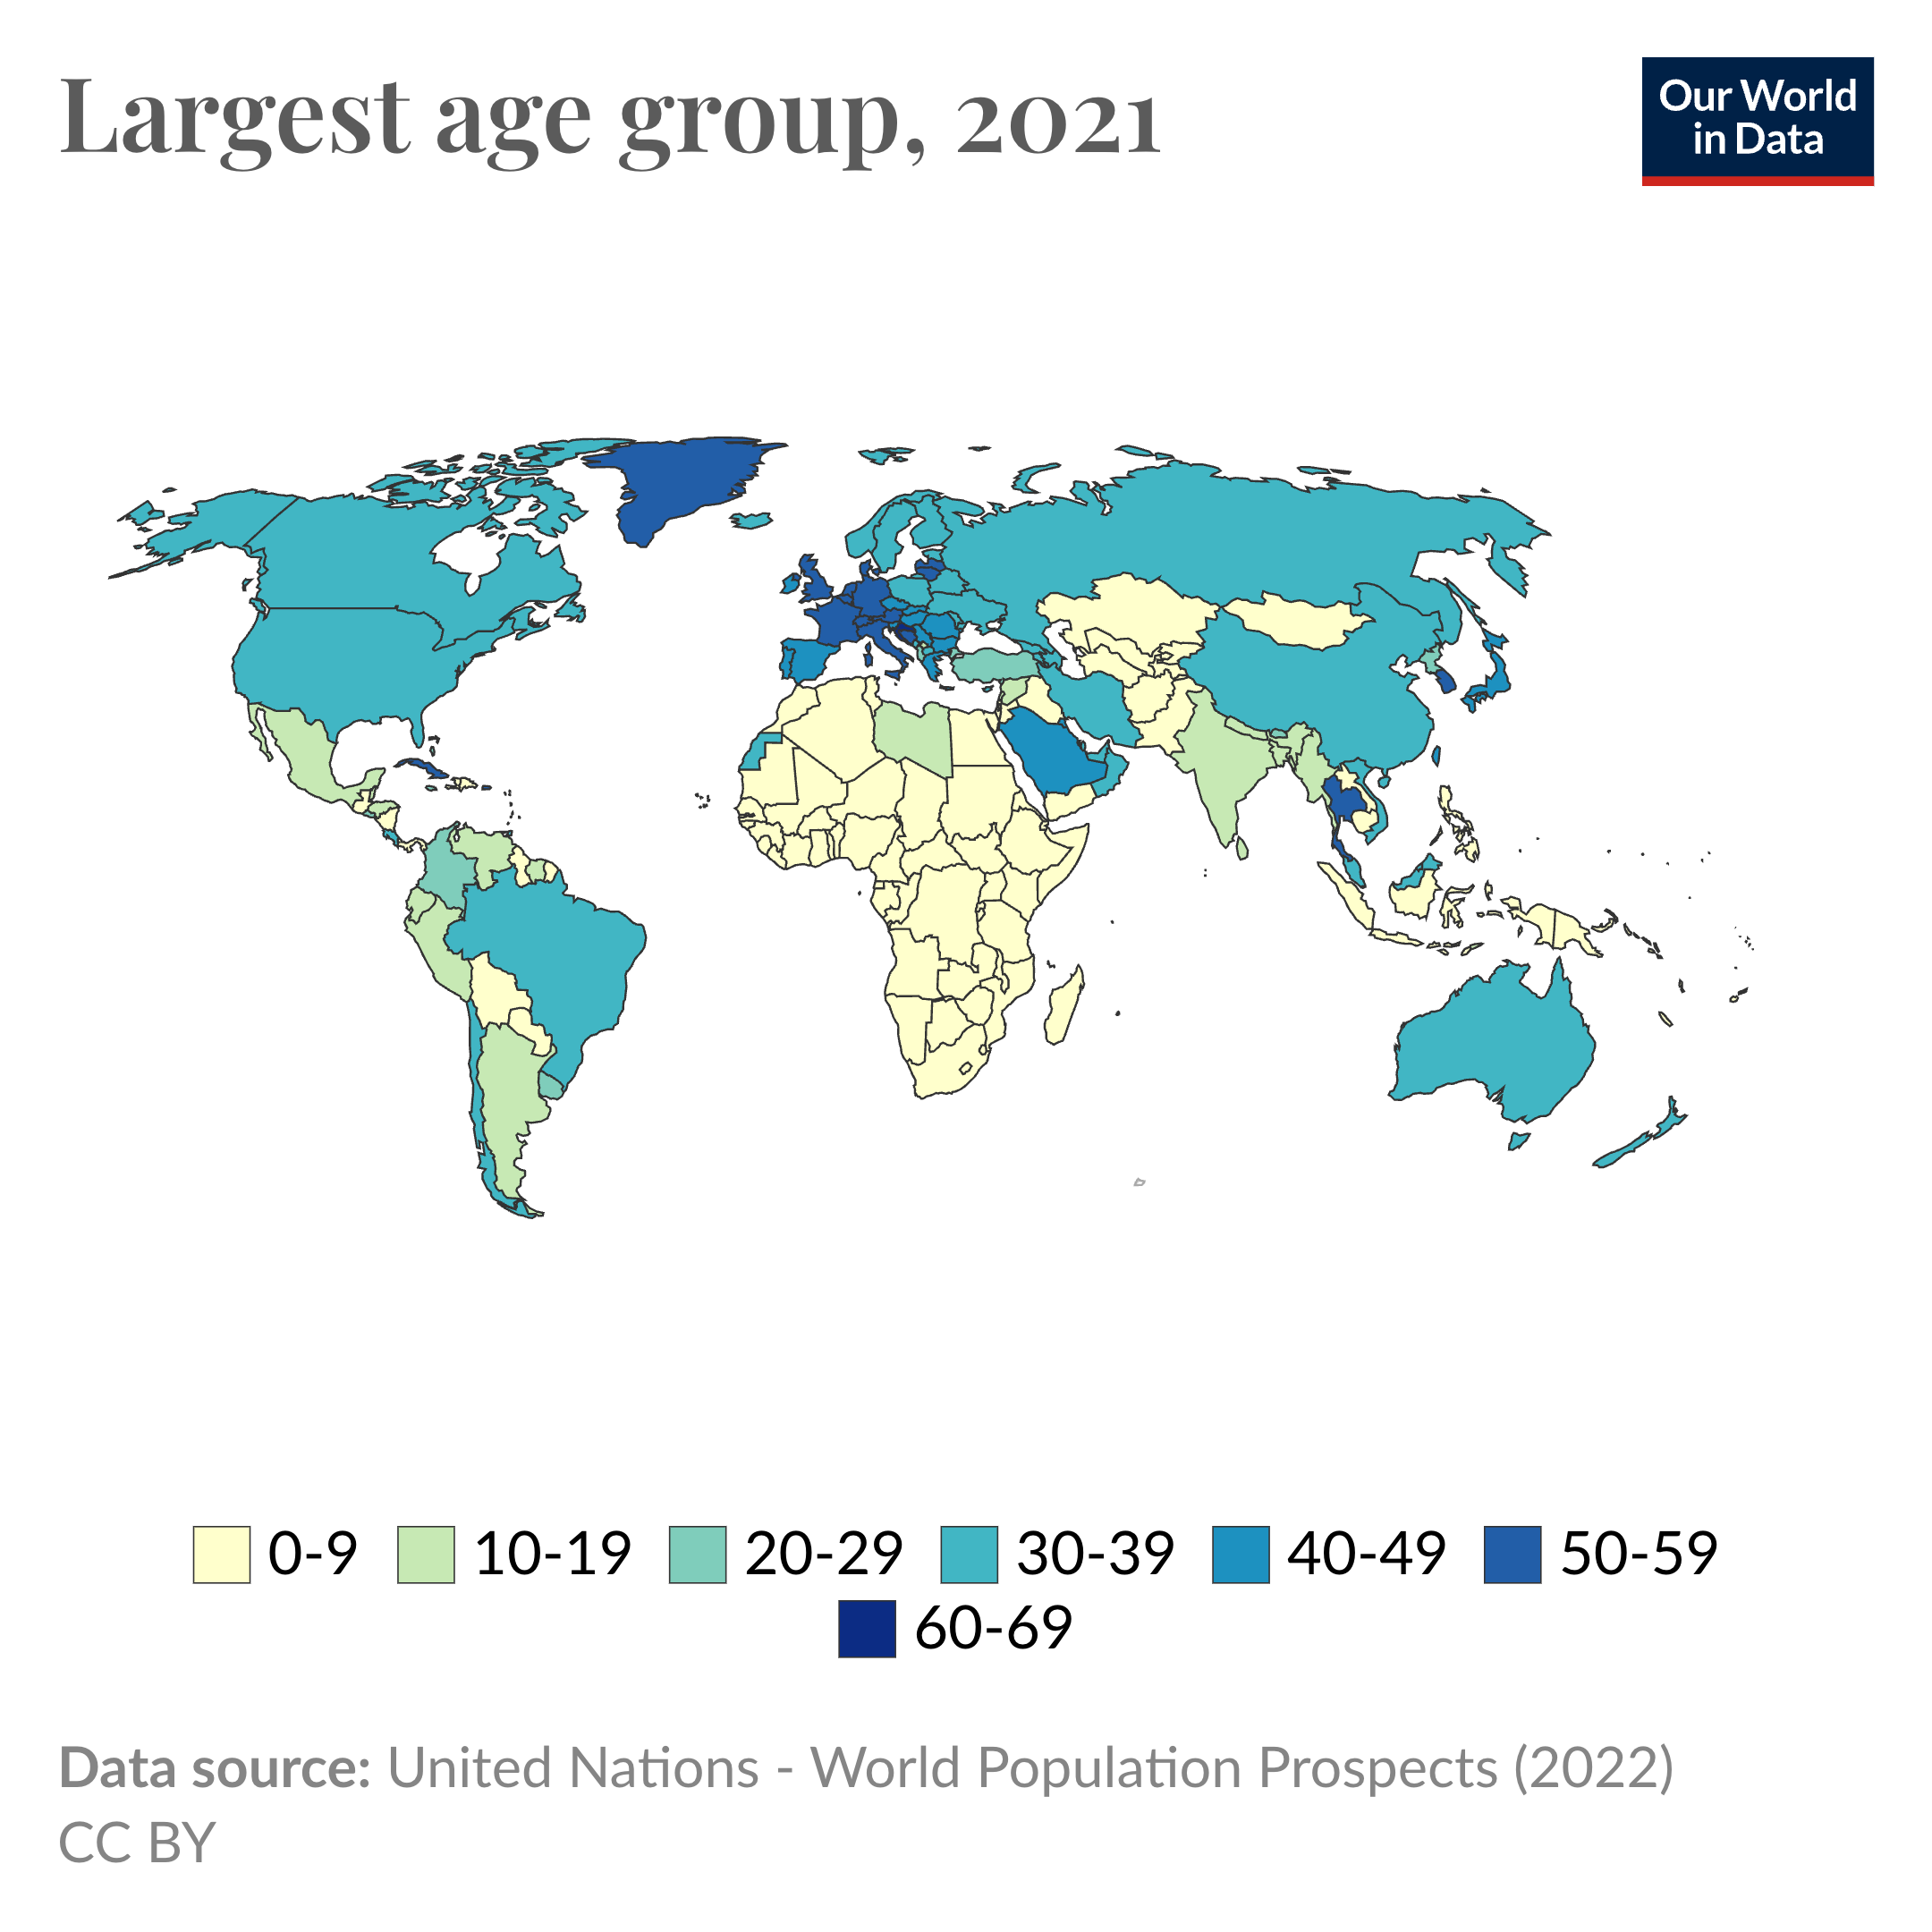
Global Patterns in Age Structure

  • Sub-Saharan Africa → youthful age structure
  • Europe and East Asia → aging populations
  • North America → moderate aging
  • India and parts of South Asia → large working-age cohorts

Future growth concentrated in regions with youthful structures.

The age structure of populations varies widely across countries. OWID / Fiona Spooner

The age structure of populations varies widely across countries. OWID / Fiona Spooner

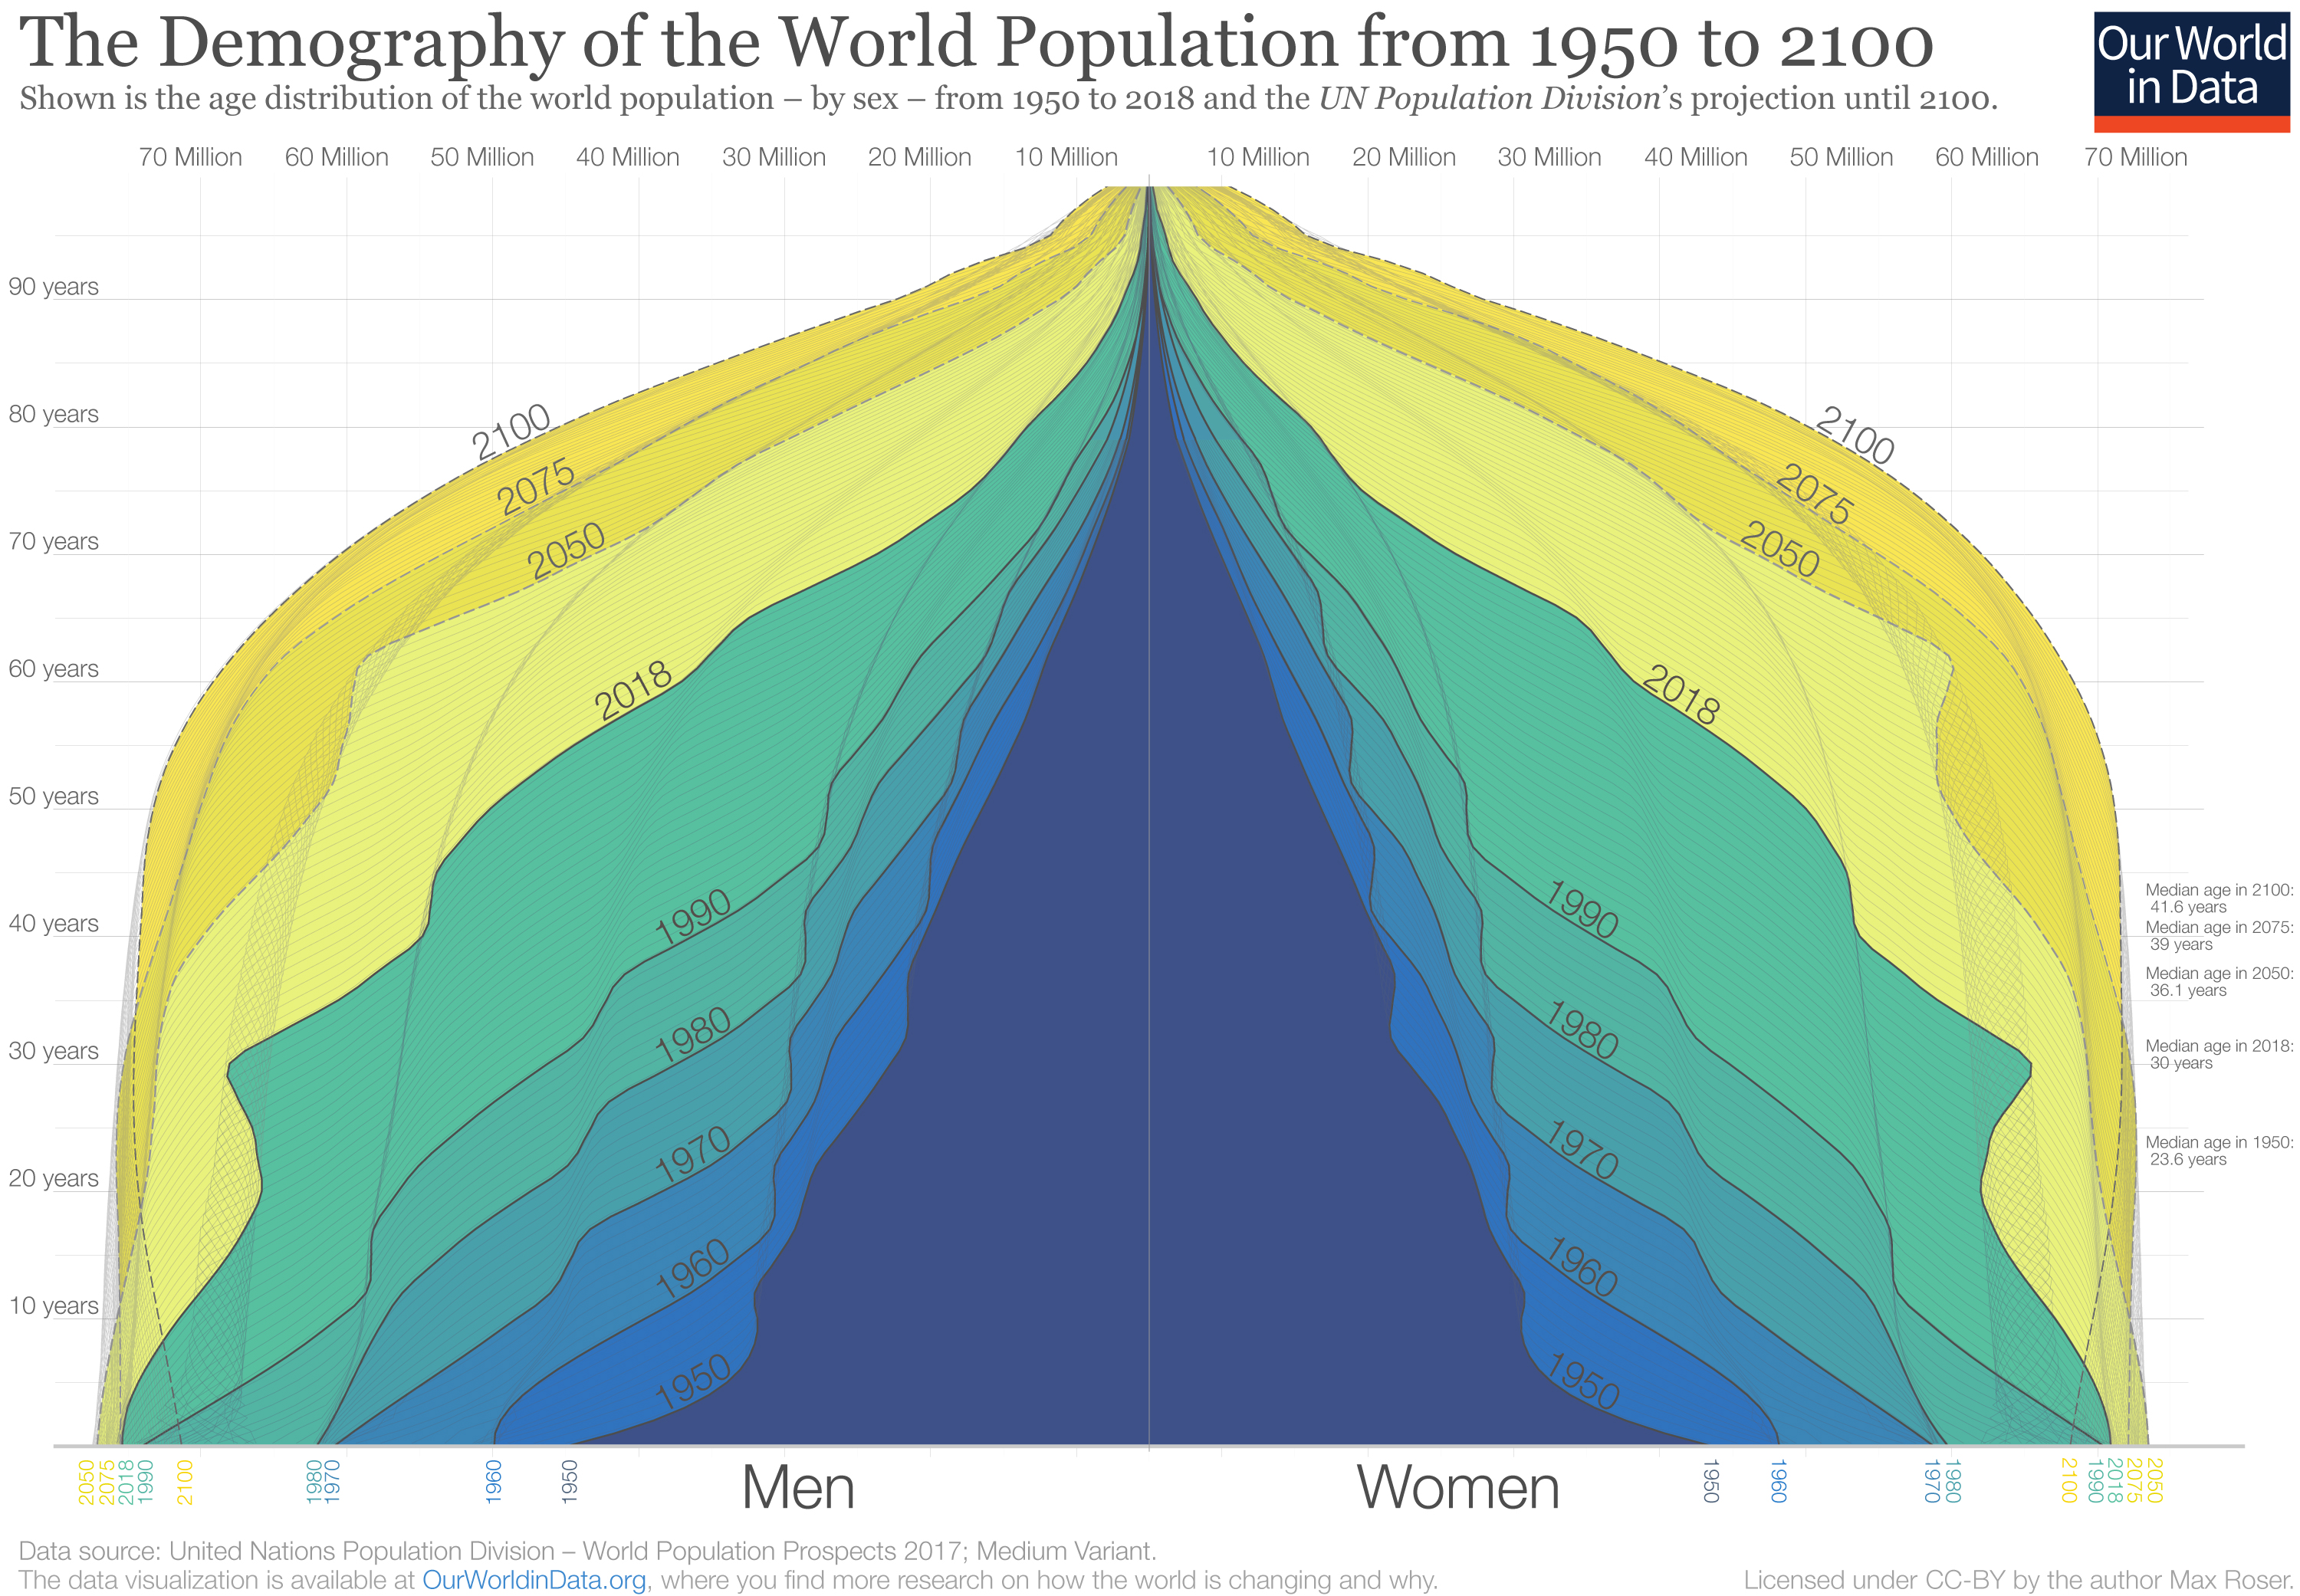
The world is aging as fertility declines and life expectancy increases

  • 1950: world population characterized by a wide base (high fertility, many children)
  • Share of children (0–14) has declined substantially since mid-20th century
  • Share of working-age population (15–64) increased through late 20th century
  • Share of older adults (65+) has risen steadily and continues to rise
  • Median global age increased from ~24 years (1950) to ~30+ years today
  • Many countries transitioning from expanding to more rectangular or contracting structures
  • Turning point: the global share of children has peaked and is declining, while the share of older adults is rising — marking a structural shift toward global population aging

Economic and Social Implications of Age Structure

  • Workforce size depends on working-age population
  • Youthful populations → potential demographic dividend
  • Aging populations → shrinking labor force
  • Dependency ratio: Number of dependents relative to working-age adults

Demography shapes economic growth and policy decisions. For example:

  • Pronatalist incentives: cash allowances, childcare subsidies (China, South Korea)

  • Policy reversal: removal of child limits as fertility declines (Vietnam)

  • Immigration emphasis: labor force and demographic stabilization (Singapore)

  • Family-friendly social policy: parental leave, tax benefits (France, Italy)

Old-age dependency ratio, 1950 to 2023. OWID.

Old-age dependency ratio, 1950 to 2023. OWID.

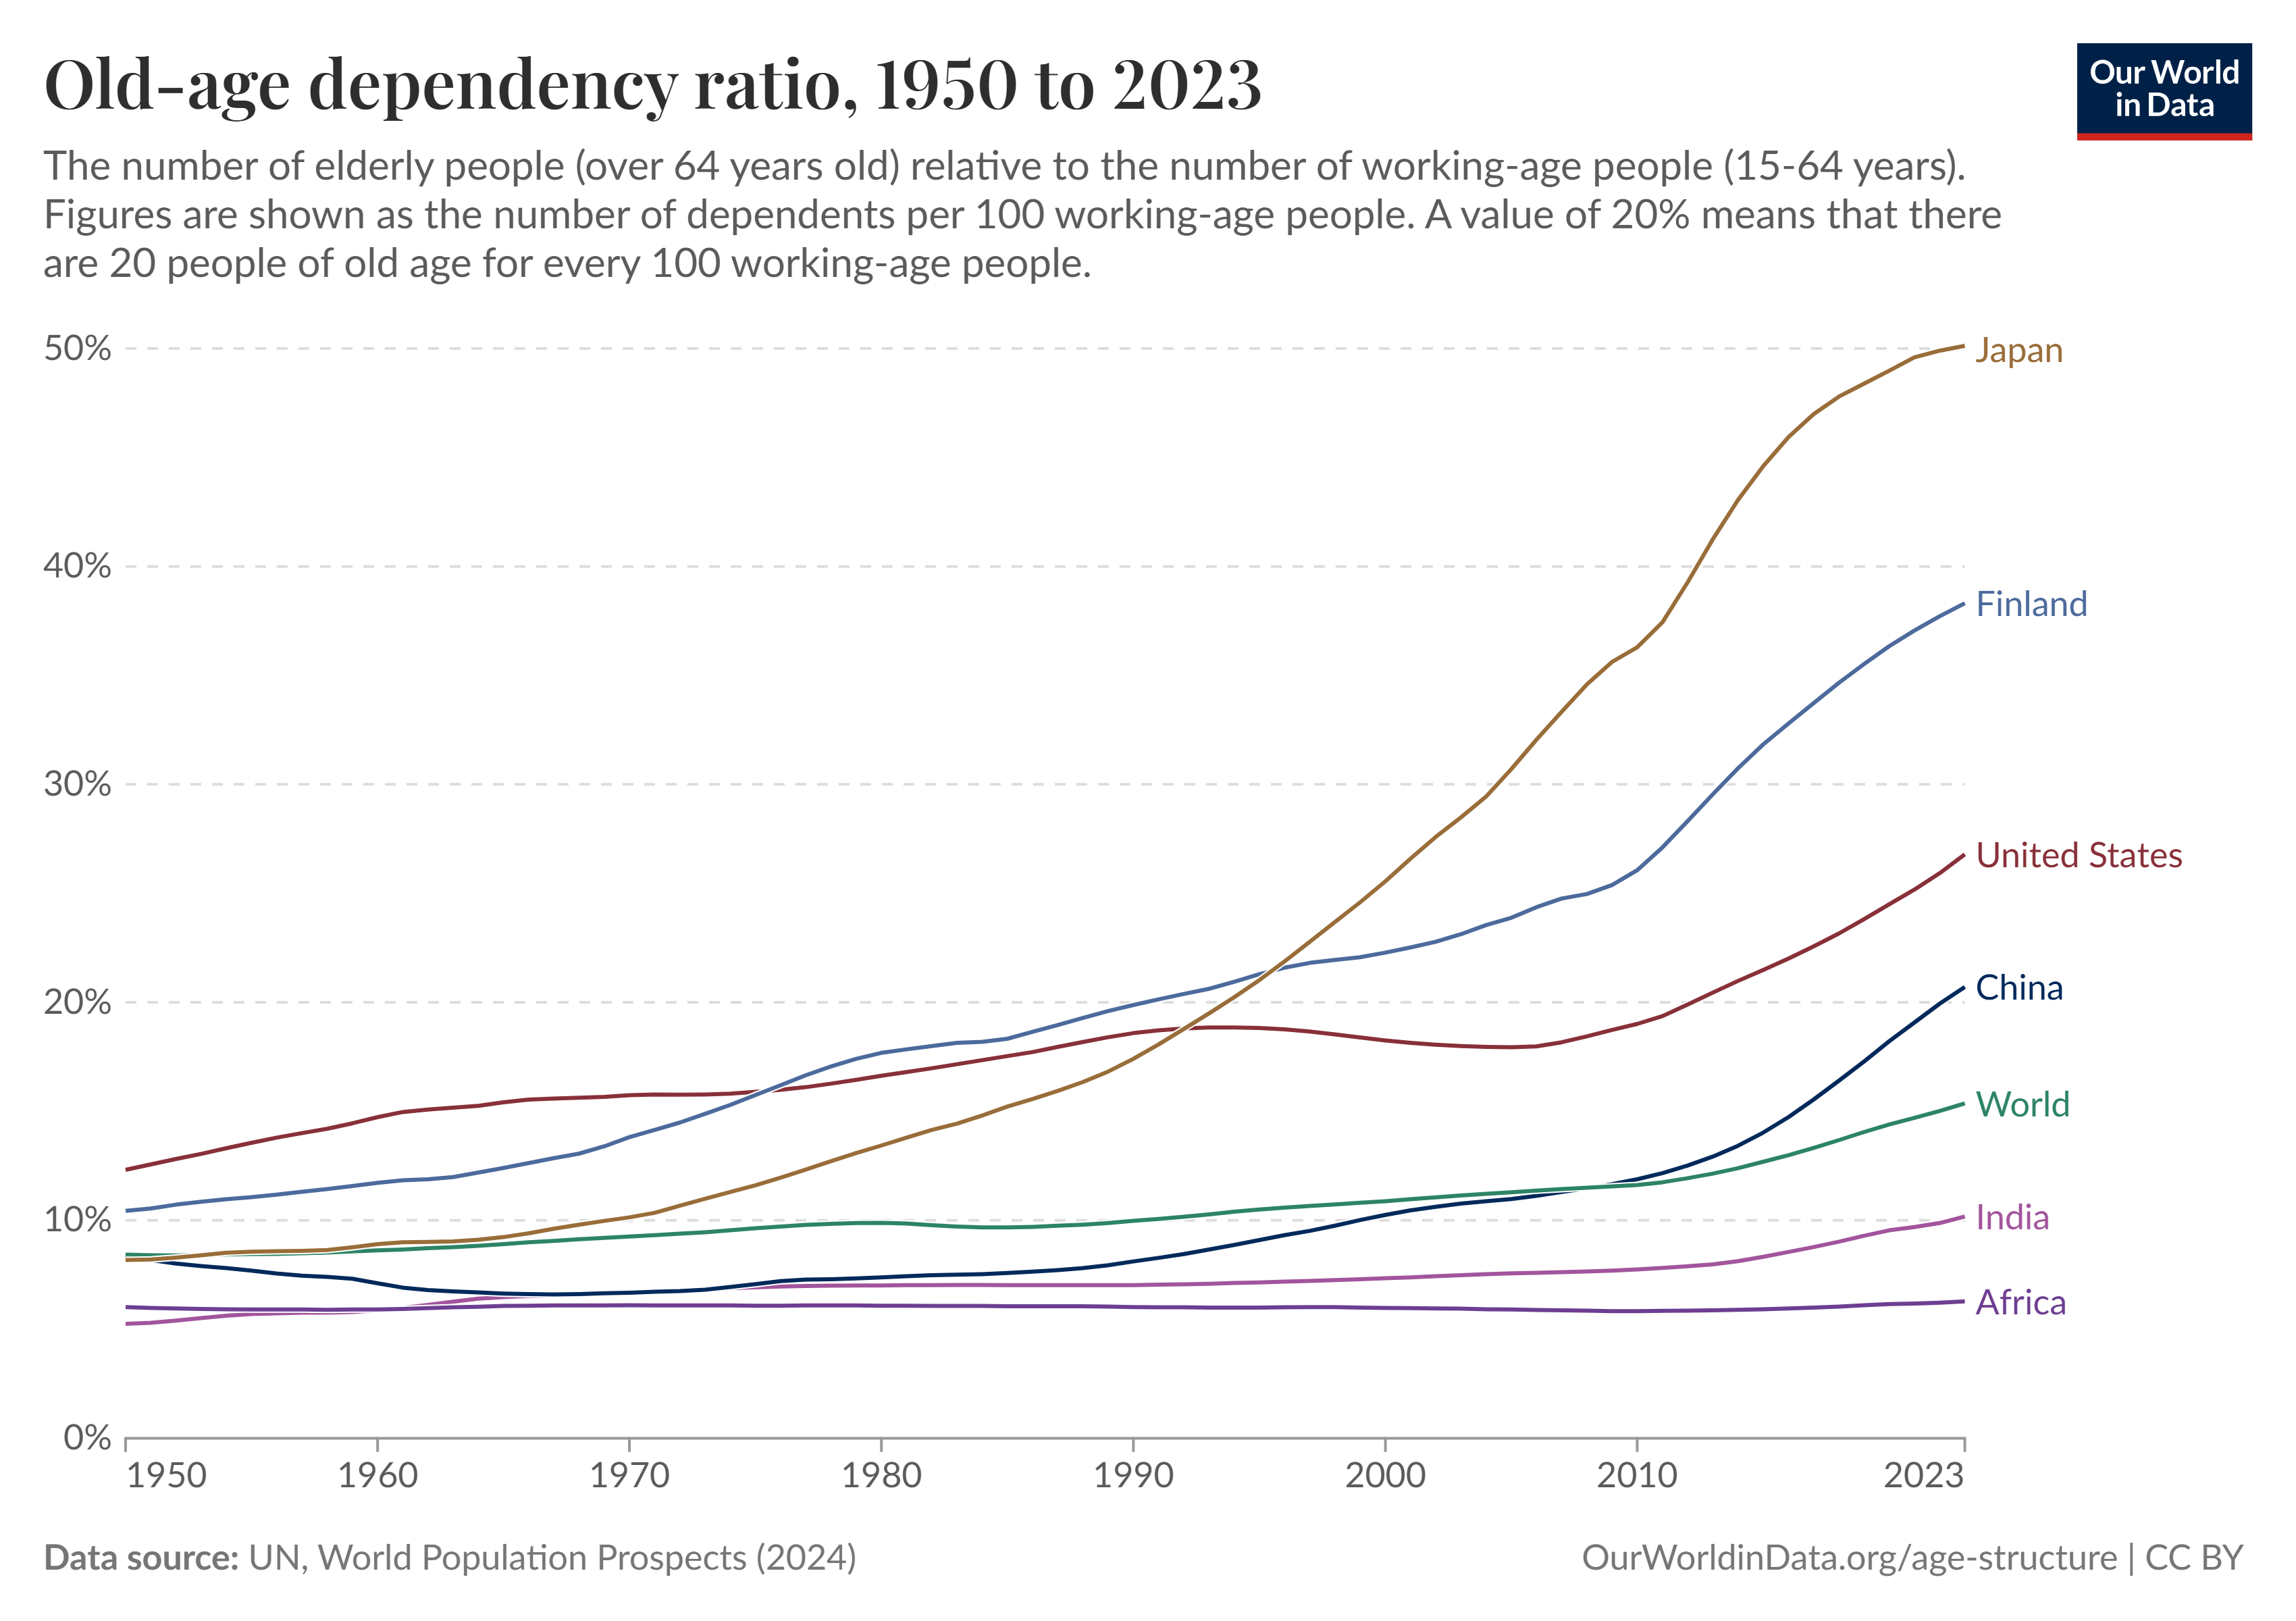
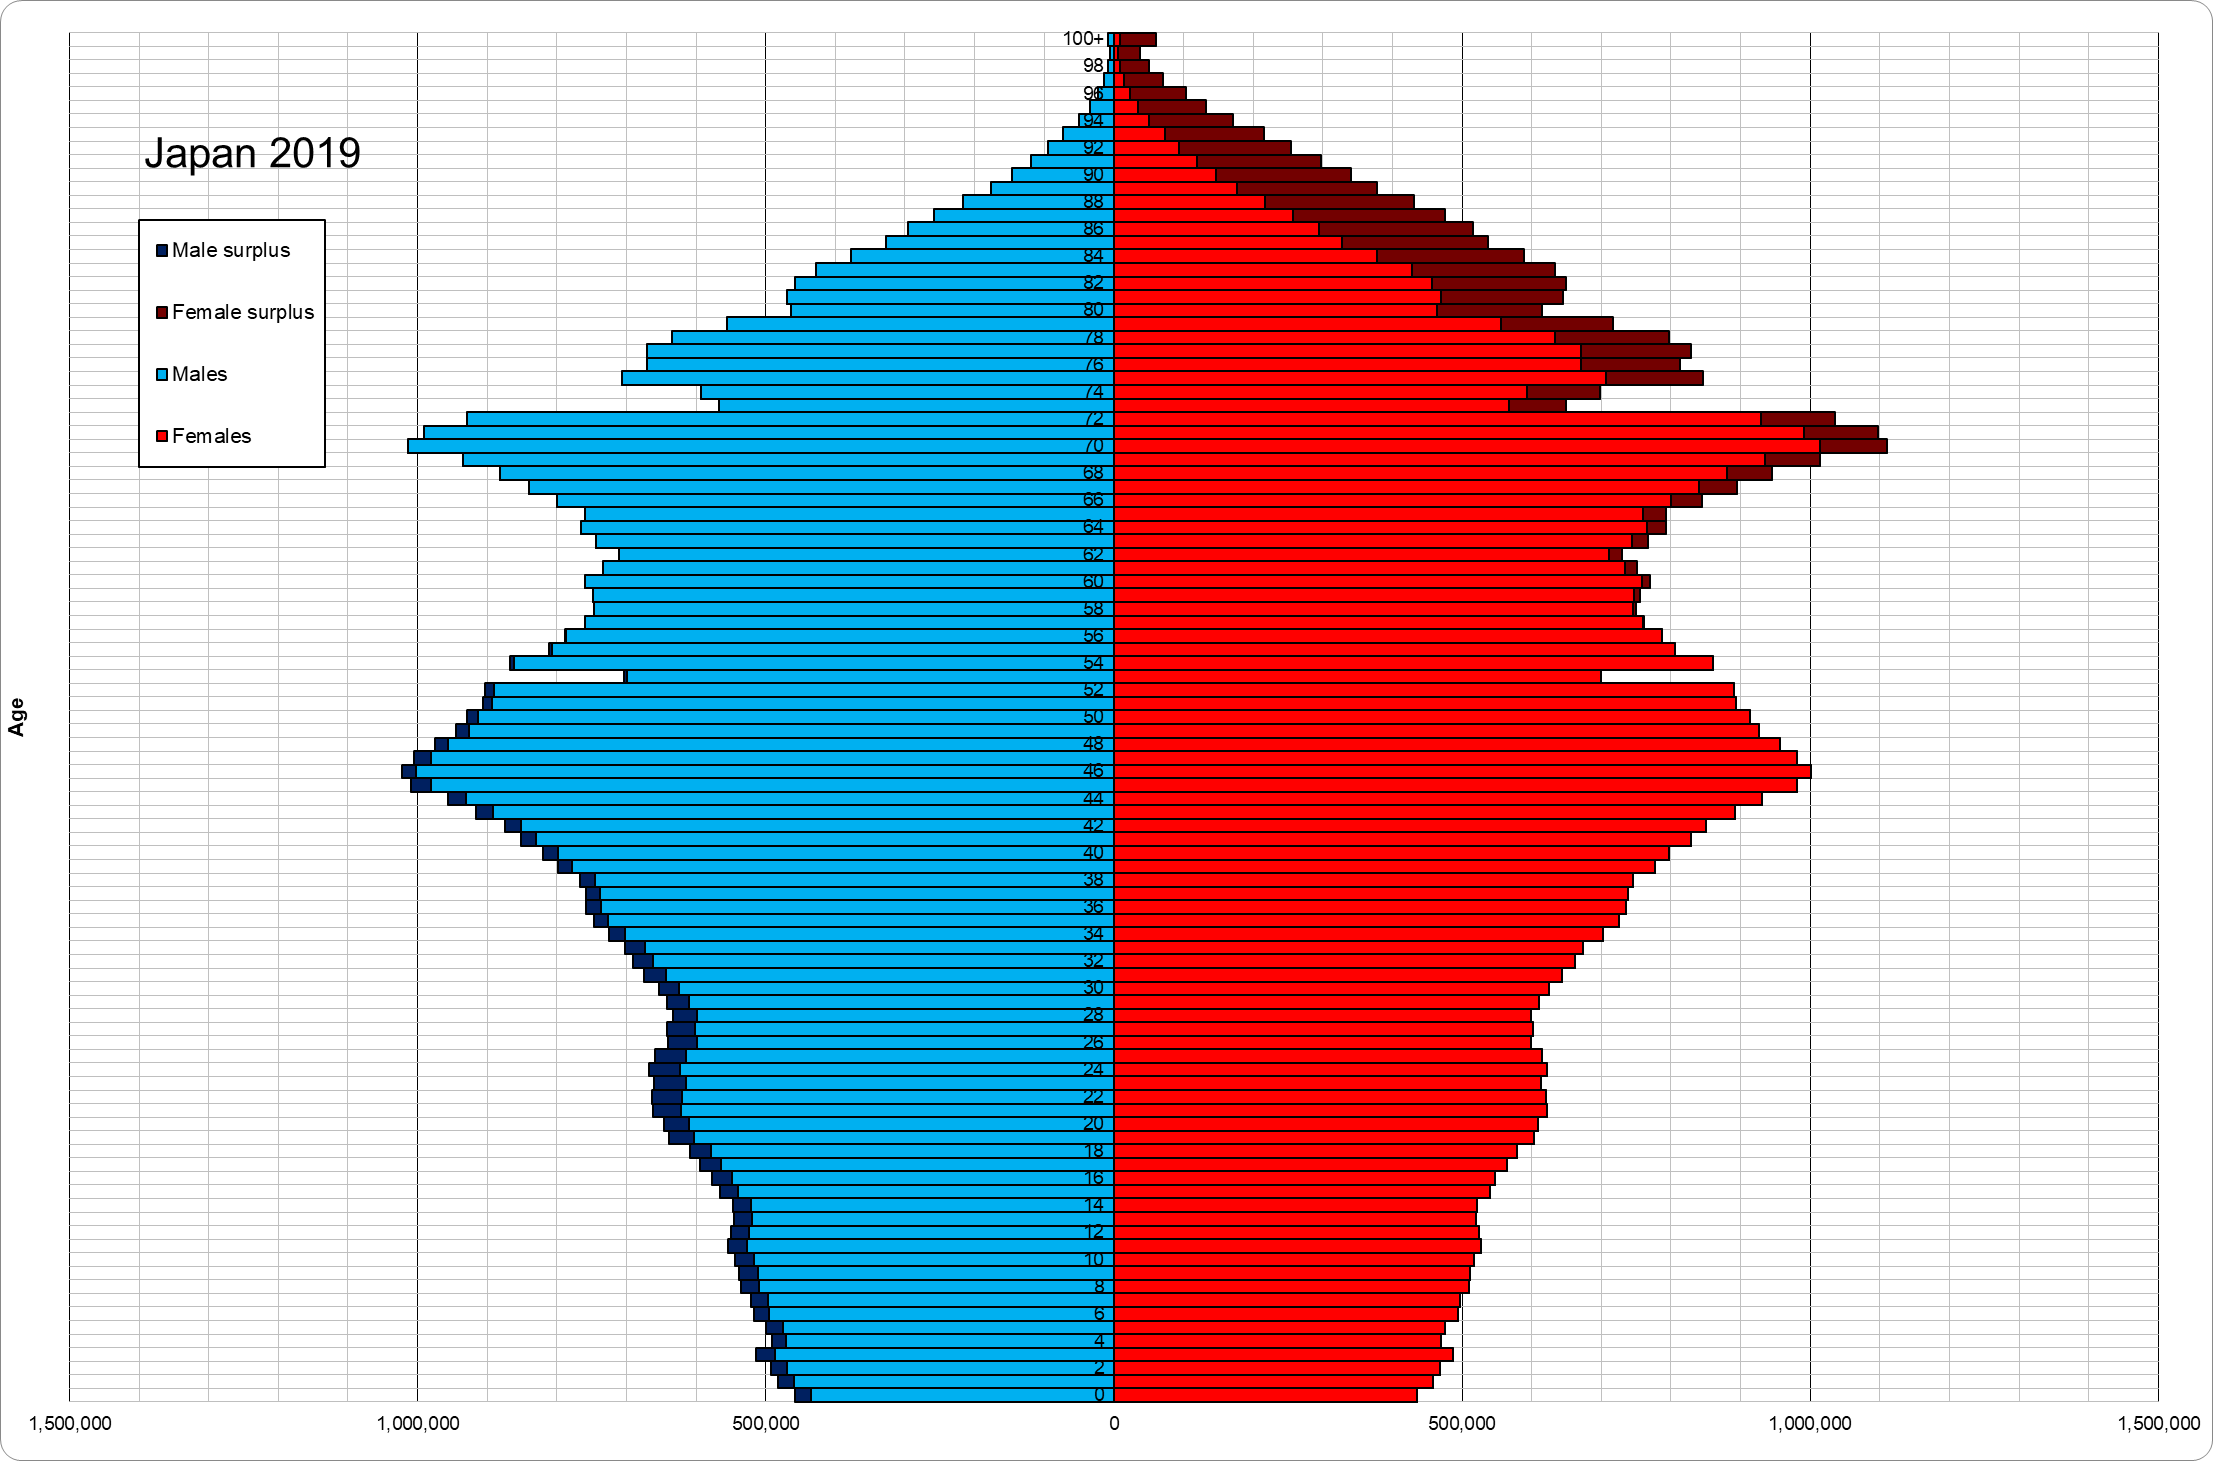
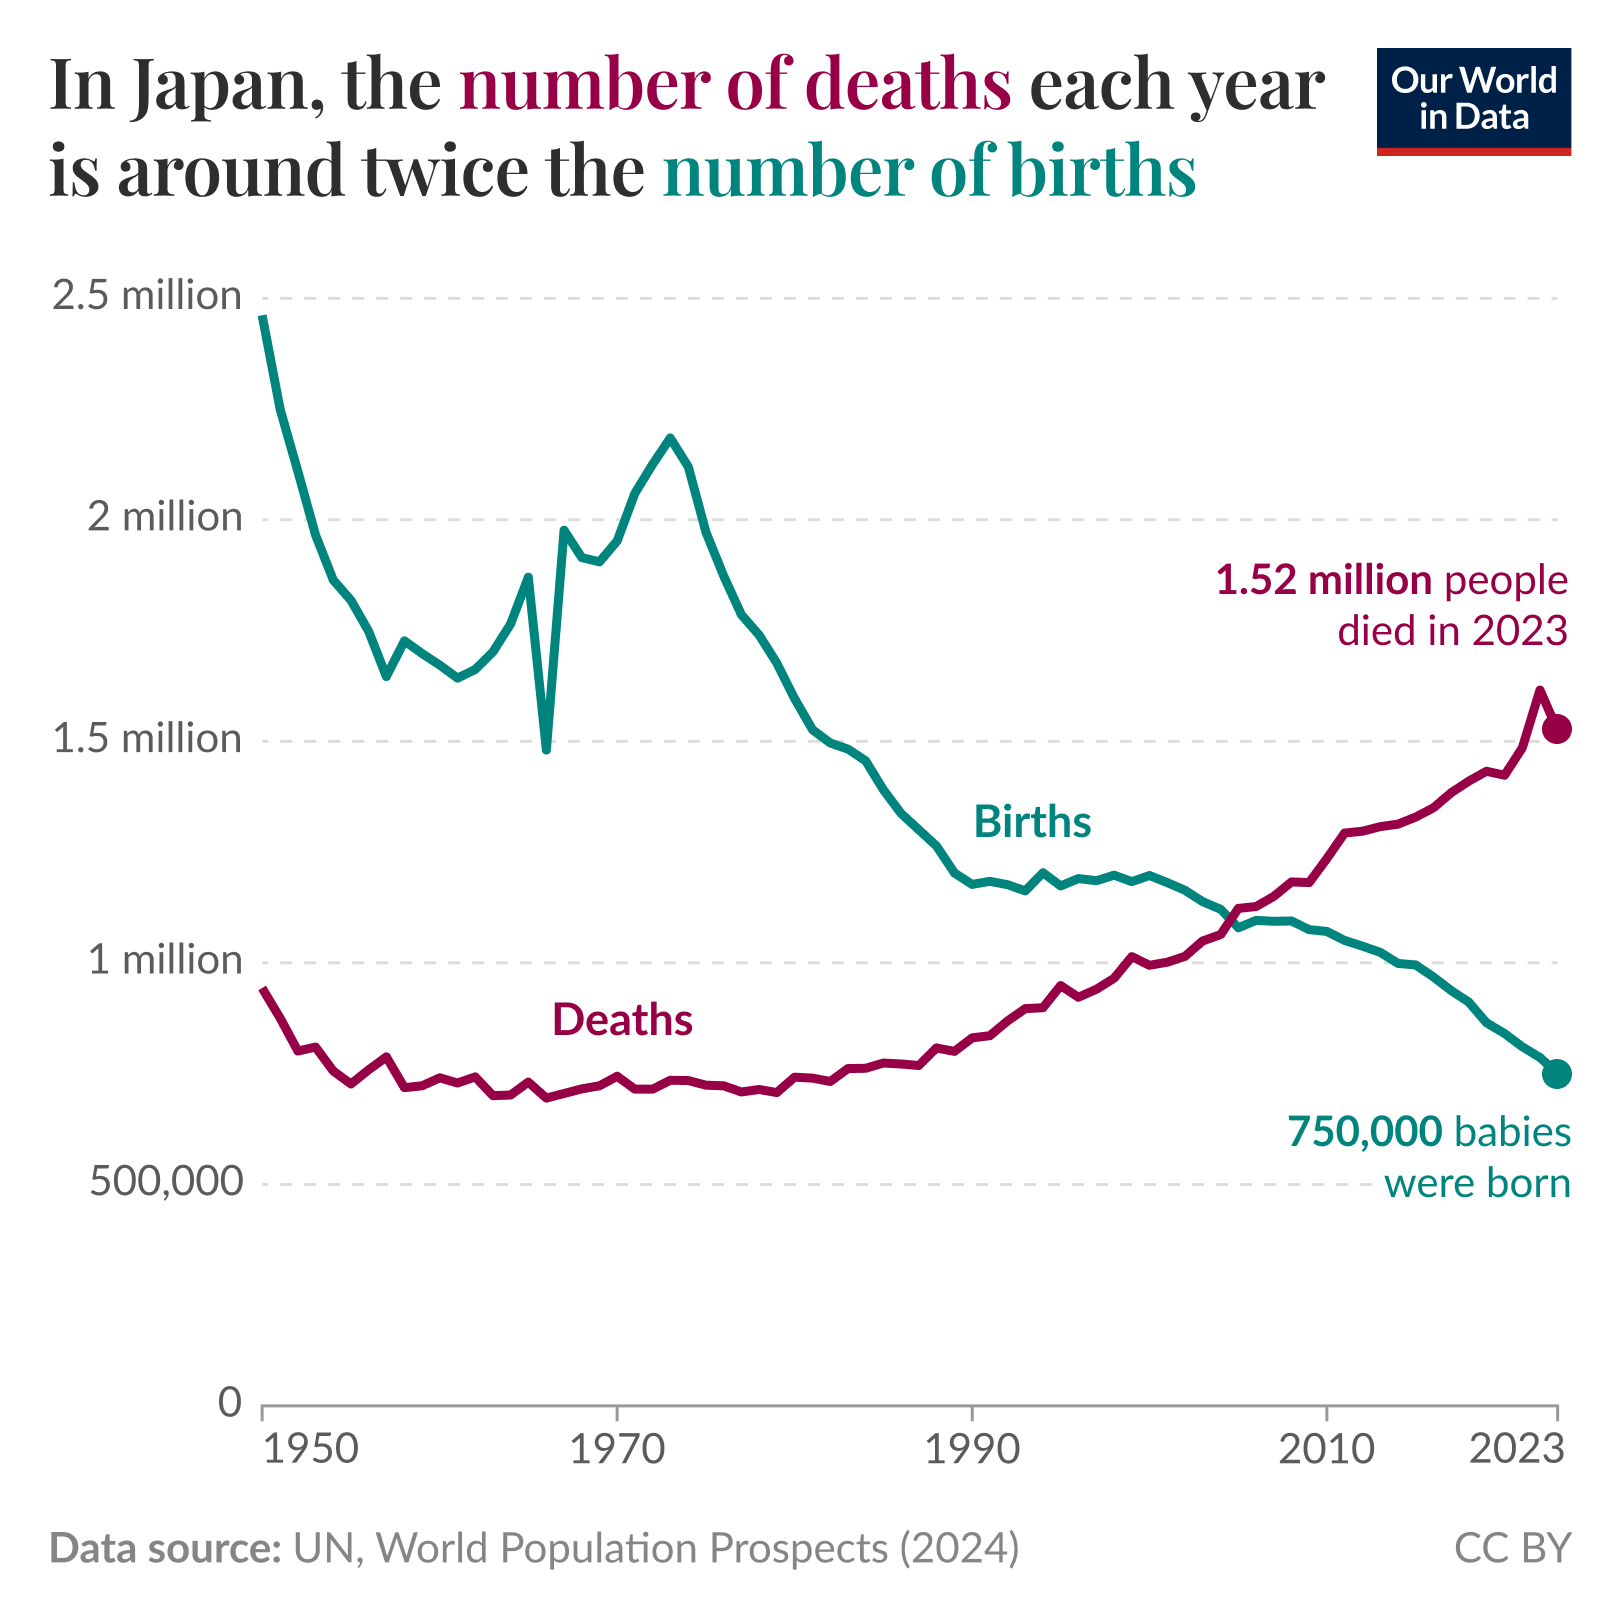
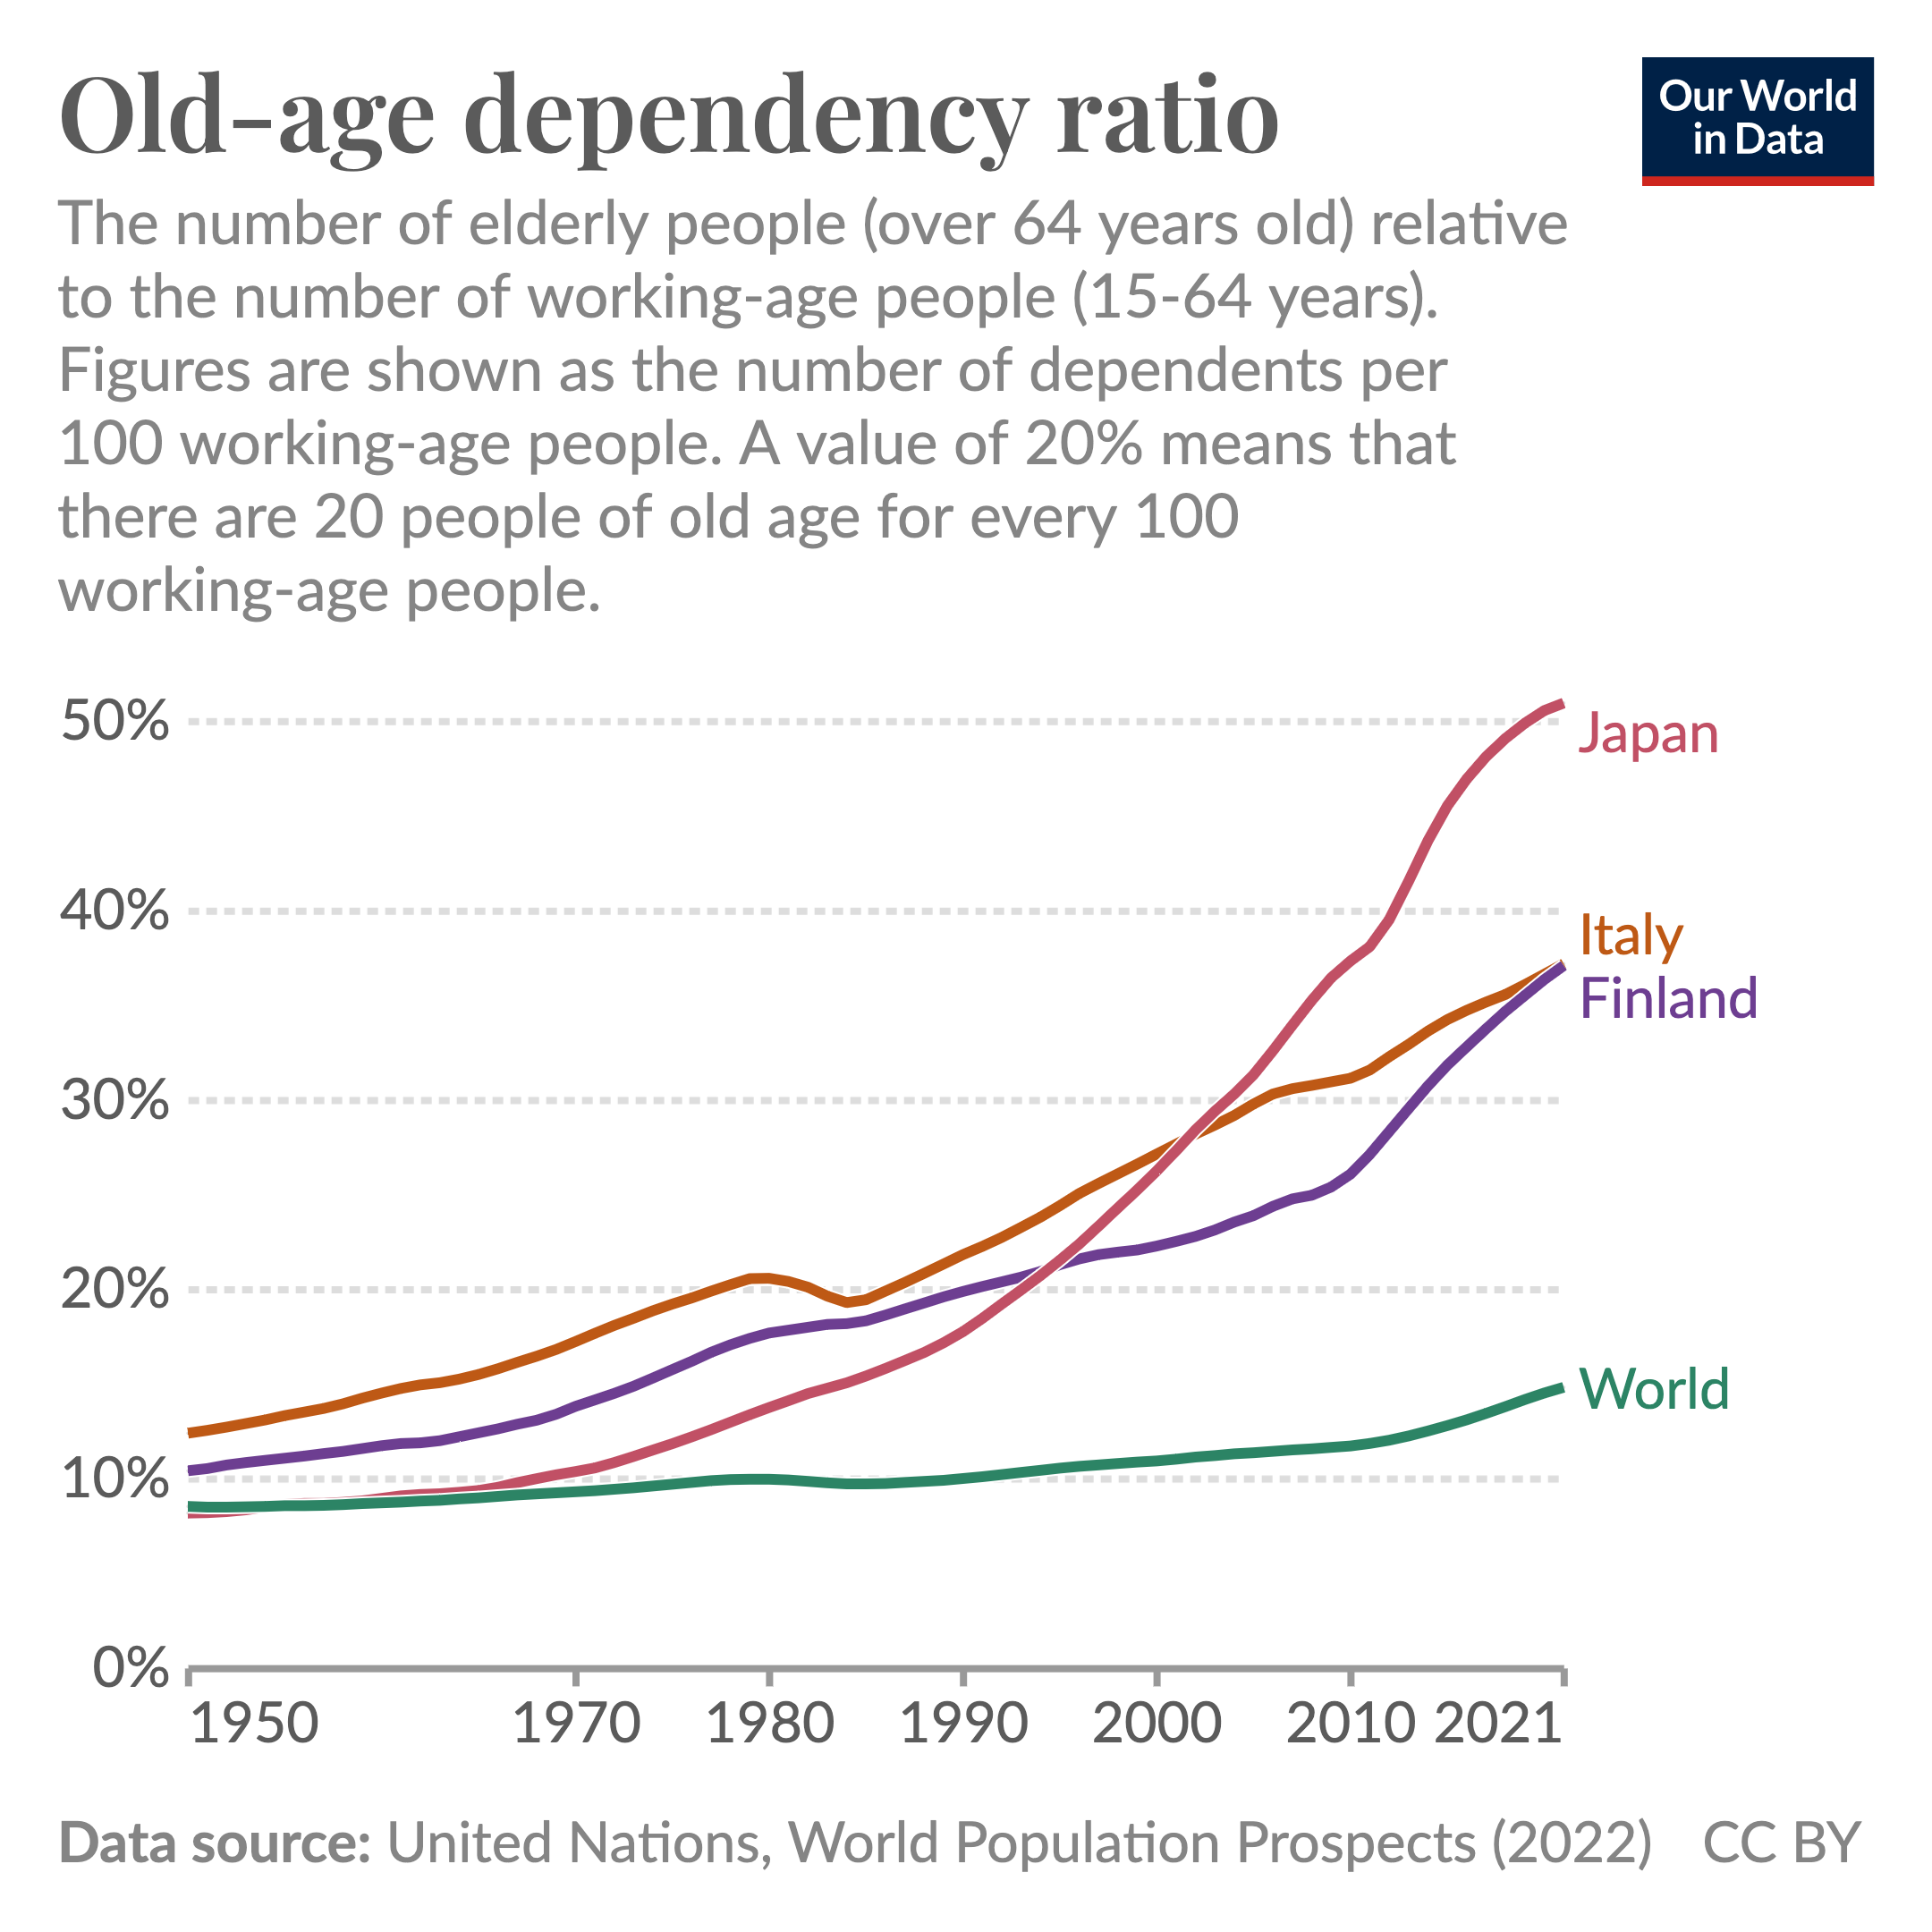
Case Example: Japan — Rapid Aging

  • Fertility well below replacement
  • High life expectancy
  • Population declining
  • Median age among highest globally
  • Economic and social challenges:
    • Labor shortages
    • Rising healthcare costs

A clear example of a contracting age structure.

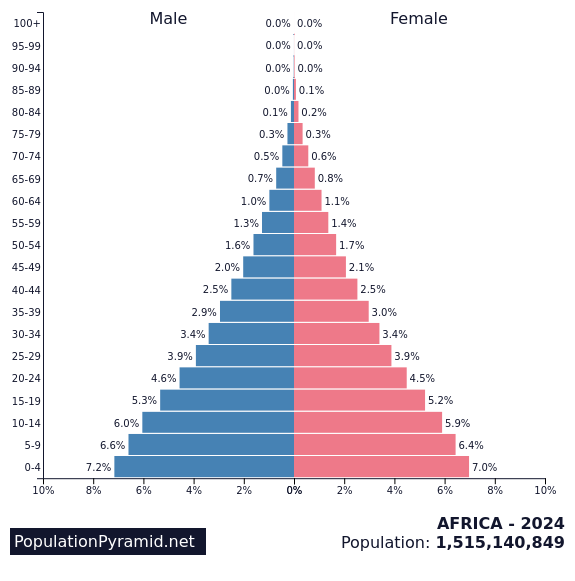
Case Example: Sub-Saharan Africa — Youthful Populations

  • High proportion under age 15
  • Fertility above replacement in several countries
  • Rapid urbanization underway
  • Large future workforce potential
  • Significant demand for education, infrastructure, and jobs

Youthful structure → strong demographic momentum.

Demographic Momentum

  • Demographic momentum: continued population growth after fertility declines
  • Caused by a large cohort of young people entering reproductive age
  • Replacement-level fertility (~2.1) does not immediately stabilize population
  • Youthful age structures → continued growth
  • Aging age structures → stabilization or decline
  • Population change unfolds over decades — demography has inertia

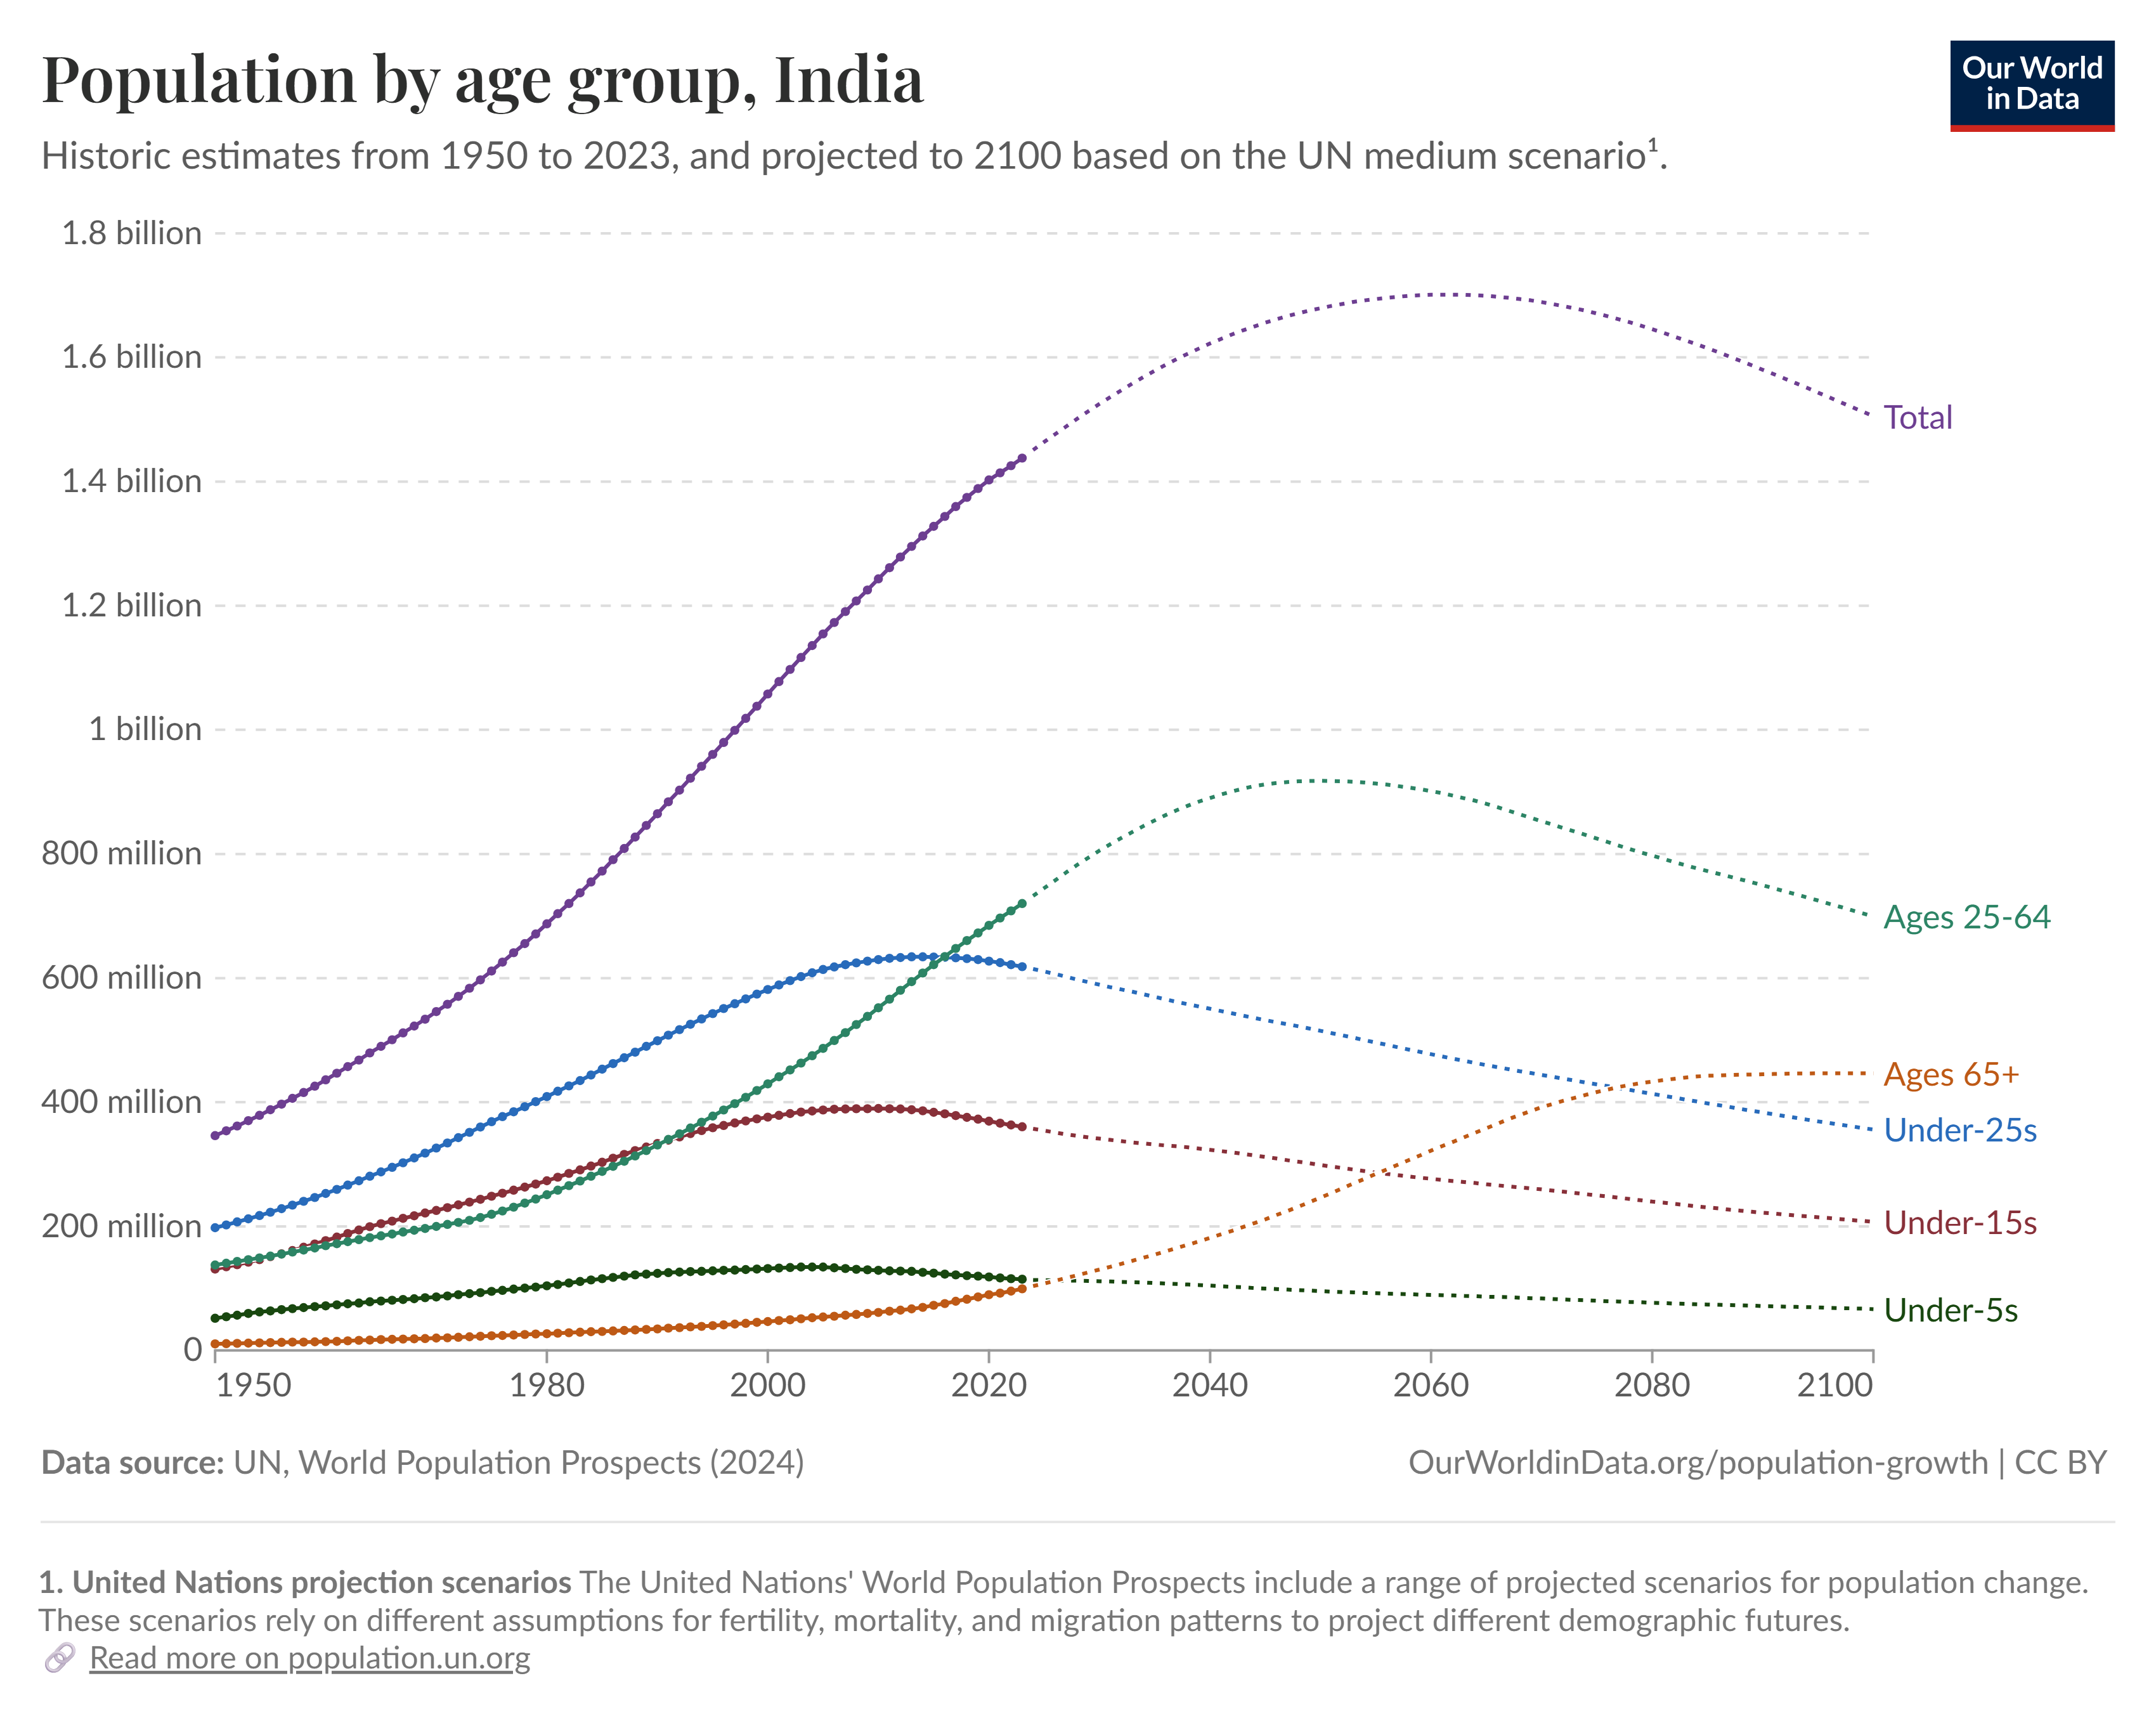
India: Growth Continuing — But a Turning Point Reached

  • India is now the world’s most populous country
  • Total population still growing and projected to peak later this century
  • However:
    • Number of children has already peaked (around 2011)
    • Fertility has declined to near replacement level (~2.0)
  • Future growth driven largely by demographic momentum, not rising fertility
  • India is transitioning from rapid expansion toward stabilization
  • Even in fast-growing countries, the demographic transition is already well underway.

Population vs Consumption

Population vs. Consumption

  • Environmental impact depends on:
    • How many people
    • How much each person consumes
  • High-income countries:
    • Lower population growth
    • Much higher per-capita energy and resource use
  • Low-income countries:
    • Faster population growth
    • Much lower per-capita consumption

Key distinction:
A smaller population with high consumption can have greater impact than a larger population with low consumption.

Per Capita Resource Use

  • Large differences in:
    • Energy use per person
    • Carbon emissions per person
    • Material consumption per person
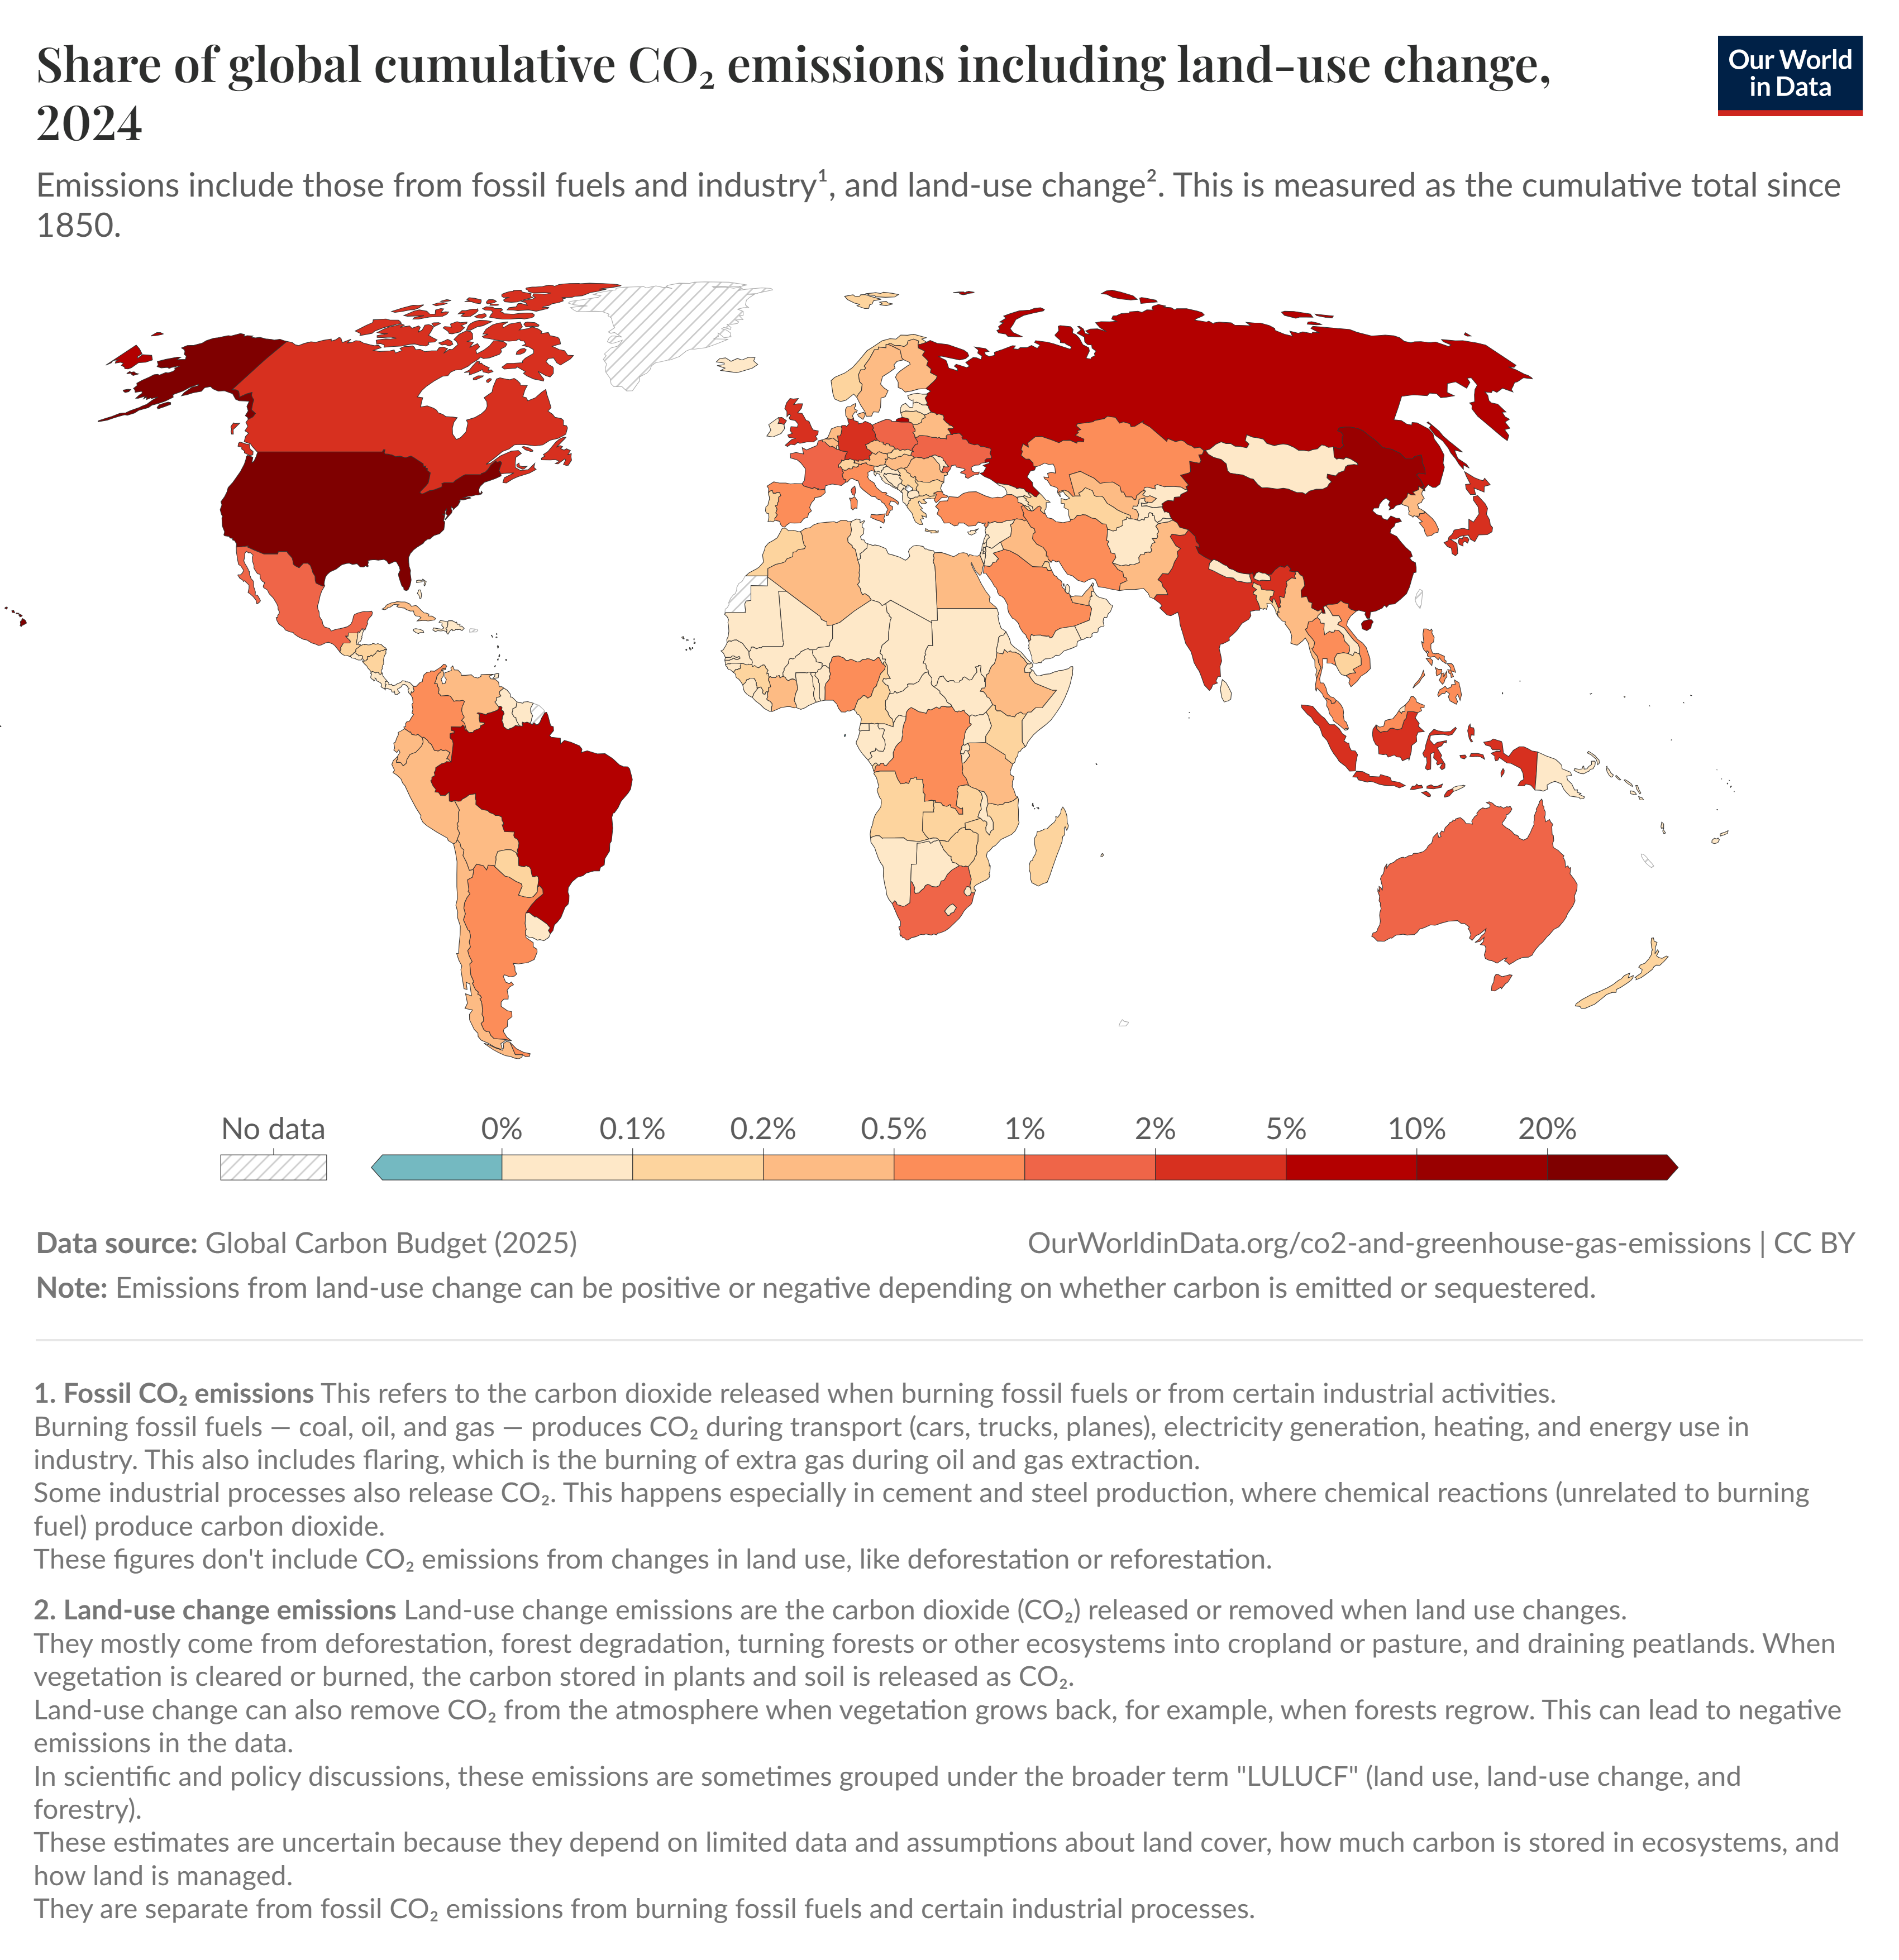
  • The highest-income countries account for a disproportionate share of global emissions
  • Future environmental pressures depend on both:
    • Population growth
    • Rising affluence

Environmental impact is unevenly distributed.

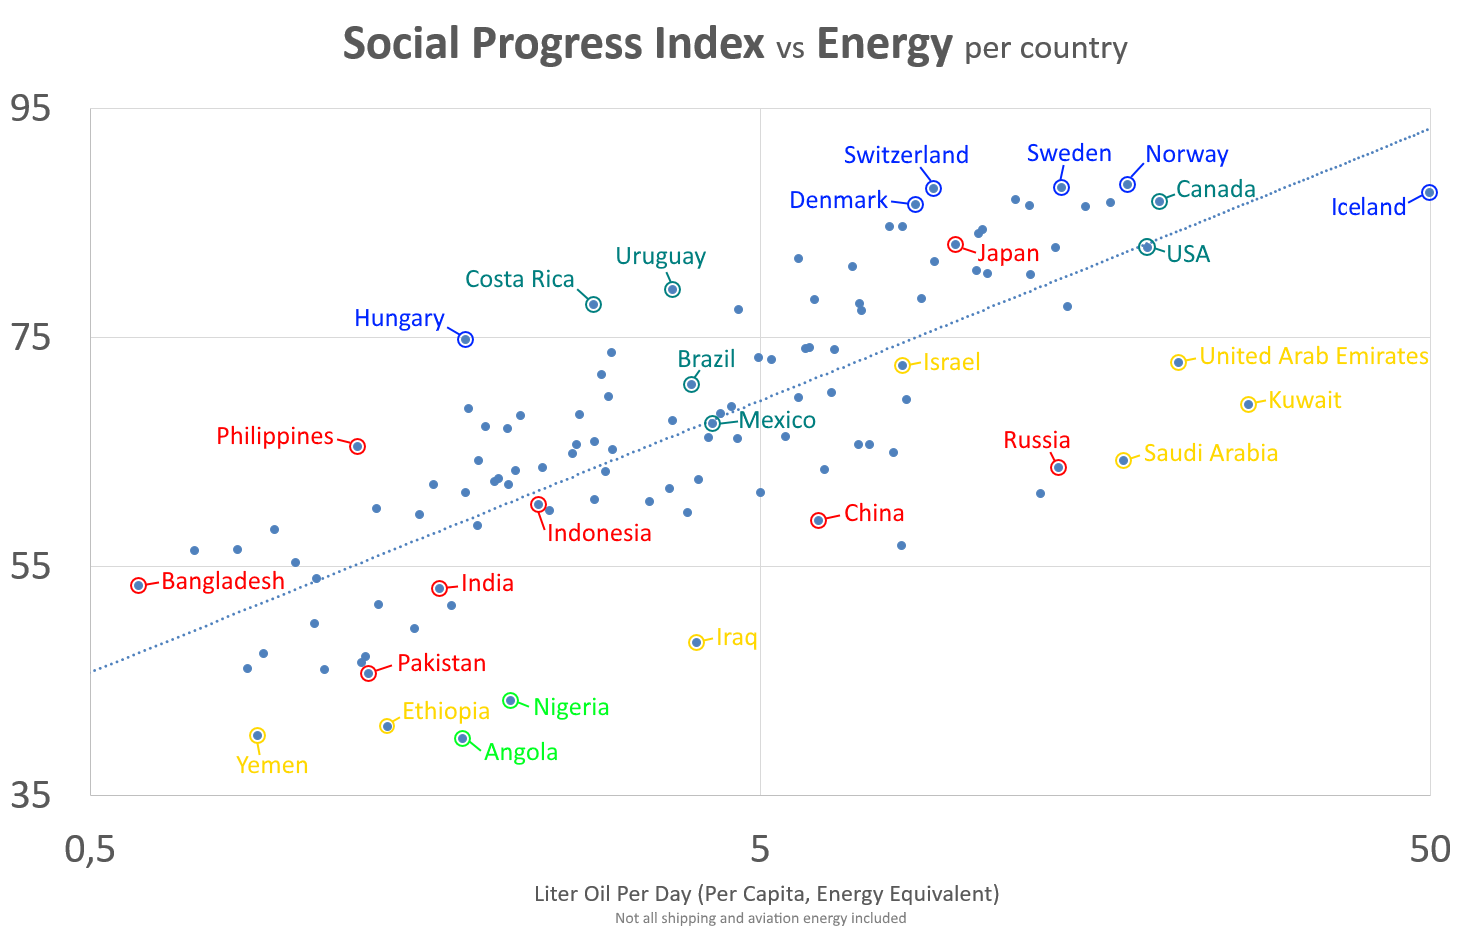
Inequality and Environmental Burden

  • Those who contribute least to emissions often experience the greatest impacts
  • Rapid population growth often occurs in lower-emitting regions
  • High-consumption lifestyles drive:
    • Energy demand
    • Waste production
    • Land-use change
  • Population and consumption interact — neither alone explains environmental change.

Synthesis: What Drives Environmental Pressure?

  • Population size matters
  • Per-capita consumption matters
  • Age structure and urbanization matter
  • Institutional and economic systems shape all three

Core takeaway:
Future environmental outcomes depend on demographic trends and consumption patterns.